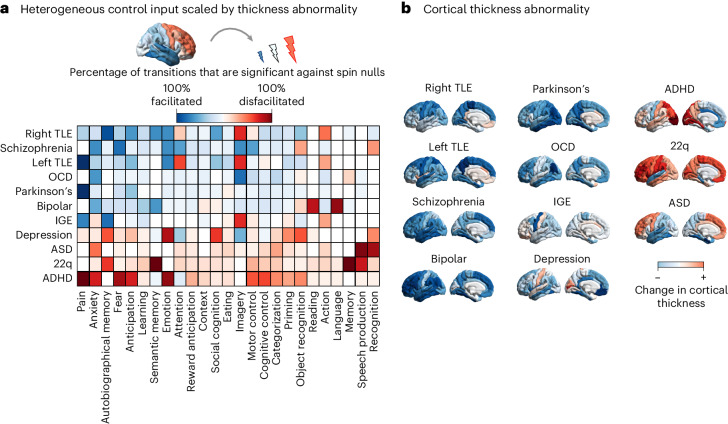
Fig. 4. Simulating the effect of changes in cortical thickness associated with diagnostic categories.
a, The effect of cortical thickness changes is modelled by varying the control input provided by each region, in proportion to the extent of its cortical thickness alteration from healthy controls (Cohen’s d): atrophied regions exert less input, and regions of increased thickness exert greater input. Heatmap shows how each diagnostic category reshapes the transition energy required to reach a given cognitive topography, presented as the percentage of transitions (out of all possible initial cognitive topographies) that are significantly facilitated (blue colour scale) or significantly disfacilitated (red colour scale). Significance is assessed against a null distribution of randomly rotated cortical thickness alteration maps with preserved mean, variance and spatial autocorrelation, such that the only differences with the original map are the neuroanatomical locations of increases and decreases. b, The changes in cortical thickness associated with each diagnostic category are shown on the cortical surface. ADHD, attention deficit hyperactivity disorder; ASD, autistic spectrum disorder; OCD, obsessive-compulsive disorder; IGE, idiopathic generalized epilepsy; right TLE, right temporal lobe epilepsy; left TLE, left temporal lobe epilepsy. Source data are provided as a Source Data file.

