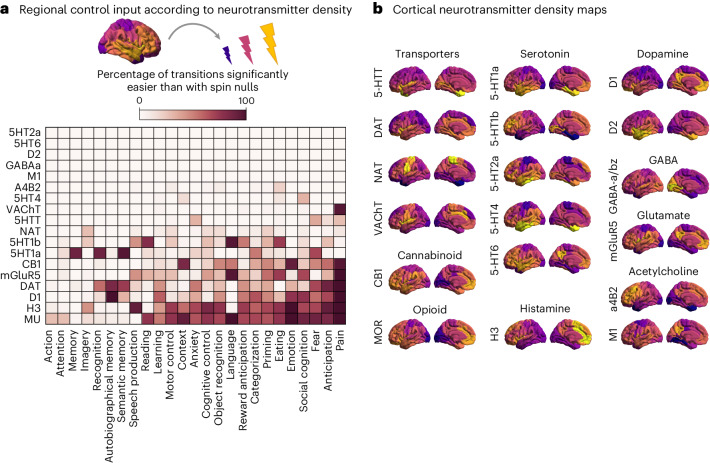
Fig. 5. Modelling how neurotransmitter systems can reshape transitions.
a, The effect of engaging each neurotransmitter receptor and transporter is modelled by changing the control input provided by each region in proportion to its density of receptor/transporter expression, measured by in vivo PET. For each receptor/transporter, the heatmap shows the percentage of transitions to each cognitive state (out of the possible start states) that require significantly less energy when using the empirical PET map, than when using null maps with preserved spatial autocorrelation and distribution of values, but occurring at different neuroanatomical locations. b, The empirical spatial distribution of each receptor and transporter is shown on the cortical surface. Source data are provided as a Source Data file.

