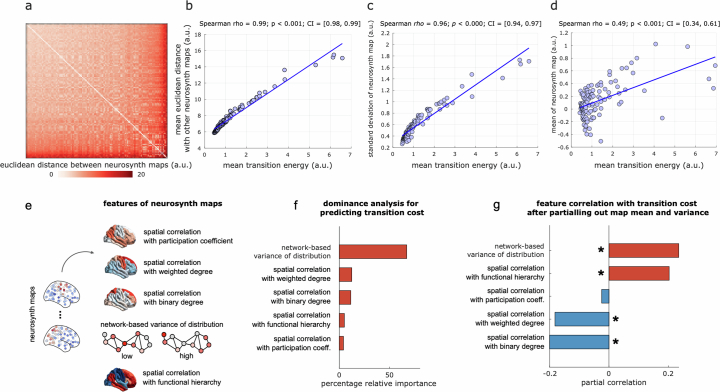
Extended Data Fig. 2. Predictors of transition energy.
(a) Euclidean distance between the vectors corresponding to each NeuroSynth map. (b) Transition energy to a given cognitive topography (averaged over all starting states) correlates with the mean Euclidean distance between its corresponding NeuroSynth map and all others (p < 0.001 from Spearman correlation, two-sided). (c) Transition energy to a given cognitive topography (averaged over all starting states) correlates with the standard deviation of its NeuroSynth map (p < 0.001 from Spearman correlation, two-sided). (d) Transition energy to a given cognitive topography (averaged over all starting states) correlates with the mean of its NeuroSynth map (p < 0.001 from Spearman correlation, two-sided). (e) Mean and variance of a NeuroSynth map are coarse descriptions that do not account for neuroanatomy. As neuroanatomically-grounded predictors of transition energy, we consider the following features of each NeuroSynth map: (i) the map’s spatial alignment with the regional distribution of participation coefficients, treating the structural connectome as a network; (ii) the map’s spatial alignment with the regional distribution of weighted node degree, treating the structural connectome as a network; (iii) the map’s spatial alignment with the regional distribution of binary node degree, treating the structural connectome as a network; (iv) a recently developed measure of variance for distributions over a network [90, 153]: unlike the usual measure of variance, which assumes independent data-points and is agnostic to their spatial location, this measure takes into account the relationships between observations. Specifically, variance of a distribution over a network is low, if high values occur at nodes that are easy to reach using a diffusion process along network paths of all length. Conversely, if the majority of high values occurs at nodes that are difficult to reach using diffusion, then the distribution will have high network-based variance. This is especially relevant because network control theory operationalises control inputs as spreading by diffusing over the network. (v) The map’s spatial alignment with the principal gradient of functional connectivity (unimodal-transmodal hierarchy) [152]. (f) Bar plot shows the relative dominance of each predictor as obtained from dominance analysis [155]. Dominance analysis distributes the fit of the model across predictors such that the contribution of each predictor can be assessed and compared to other predictors, reflecting the proportion of the variance jointly explained by all predictors, that can be attributed to each predictor. (g) Bar plot shows the partial correlation between each predictor and the average cost to transition to a given brain state, after controlling for the effects of brain state mean and variance. *, p < 0.05 from partial correlation (two-sided; see Source Data for full statistical reporting). Source data are provided as a Source Data file.

