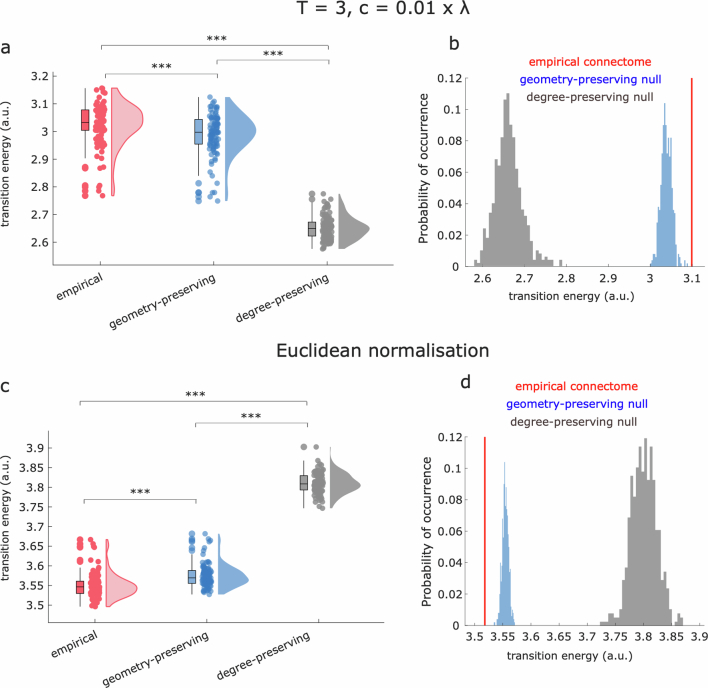
Extended Data Fig. 4. Role of network topology in supporting transitions, for alternative operationalisations of network control theory.
(a, b) participant-wise (a) and group-level (b) average transition energy for the empirical human connectome (red) and for degree-preserving (grey) and degree- and cost-preserving null models (blue), for network control with time horizon T = 3 and network normalisation factor c=0.01 × |λ(A)max|. n = 100 participants and corresponding null networks. Box-plots: center line, median; box limits, upper and lower quartiles; whiskers, 1.5× interquartile range; ***, p < 0.001 from paired-samples t-tests (two-sided). (c, d) participant-wise (c) and group-level (d) average transition energy for the empirical human connectome (red) and for degree-preserving (grey) and degree- and cost-preserving null models (blue), for network control with all NeuroSynth maps normalised to unit Euclidean norm. Source data are provided as a Source Data file.

