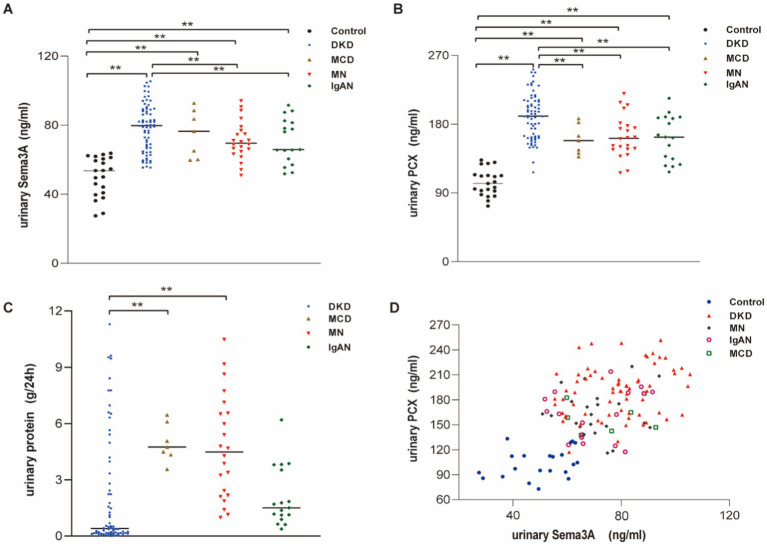
Figure 1.
Urinary Sema3A and 24 h urinary protein levels in patients with podocytopathies and controls. (A) Urinary Sema3A in patients with podocytopathies and controls. **p < 0.01. (B) Urinary PCX in patients with podocytopathies and controls. **p < 0.01. (C) Twenty-four-hour urinary protein in patients with podocytopathies. **p < 0.01. (D) Scatter plot between urinary Sema3A and PCX (n = 135).

