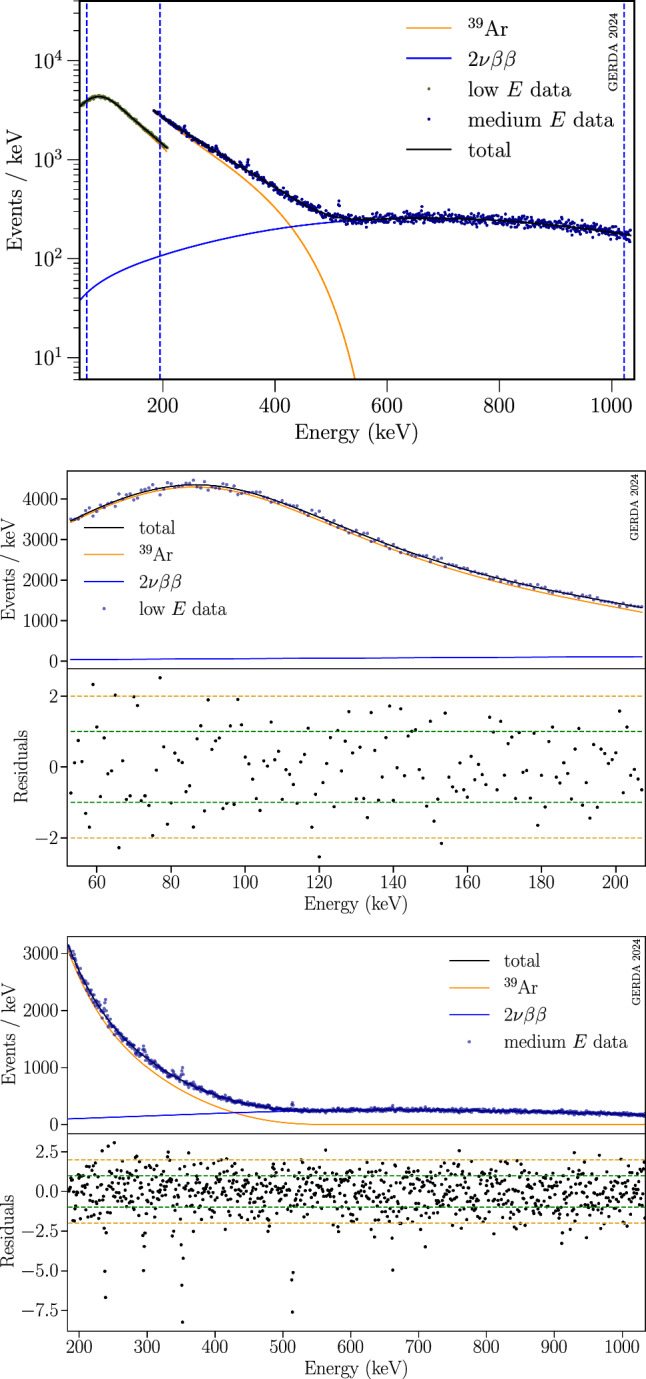
Fig. 10.

Top: empirical background fit model. The fit was performed with a tenth order polynomial and a -modified distribution. The vertical dashed, blue lines denote the lowest probed DM mass of 65 keV, the data set transition value of 195 keV, and 1021 keV as the highest potential integer DM mass below . Middle, bottom: plots of the data (blue dots) and the model (black line) in the two different energy ranges, i.e. 53–207 keV and 184–1033 keV, with the respective residuals shown below each panel. Residuals are defined as the difference between expected counts and observed counts, normalized by the square root of expected counts
