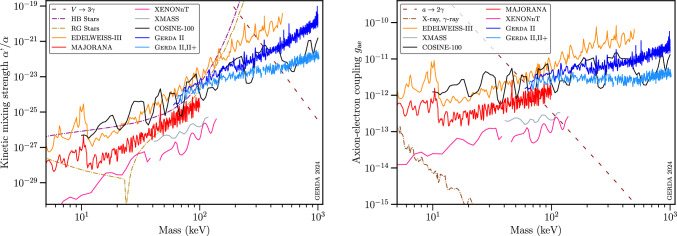
Fig. 7.
Bayesian exclusion limits on bosonic DM couplings to electrons obtained from Gerda Phase II and Phase II+ data (light blue line). The limits were deduced by converting the upper count strength limits into physics constraints including in the interaction rate both the photoelectric-like absorption and the dark Compton scattering processes, see Eq. (15). The regions around identified -lines (see Table 3 and numerical data in Supplemental Material have been omitted. Left: Bayesian constraints at 90% CI on the kinetic mixing strength of DPs. Right: Bayesian constraints at 90% CI on the coupling strength of ALPs to electrons. Results from other direct detection experiments [38–42] are shown, as well as the previous Gerda limits [2]. Note that in the COSINE-100 paper [42] the previous numerical factors of 1.2 and 4 have been used in eqs. 4 and 5. The dashed, dark red line indicates the region below which the interpretation as a DM candidate being stable on the scale of the age of the Universe is valid without further assumptions [9]. Indirect constraints from X-ray and -ray observations taken from Refs. [9, 43] are indicated by the dot-dashed, brown line. Constraints derived from red giant (RG, dot-dashed, gold line) and horizontal branch (HB, dot-dashed, purple line) star energy losses are discussed in [44]

