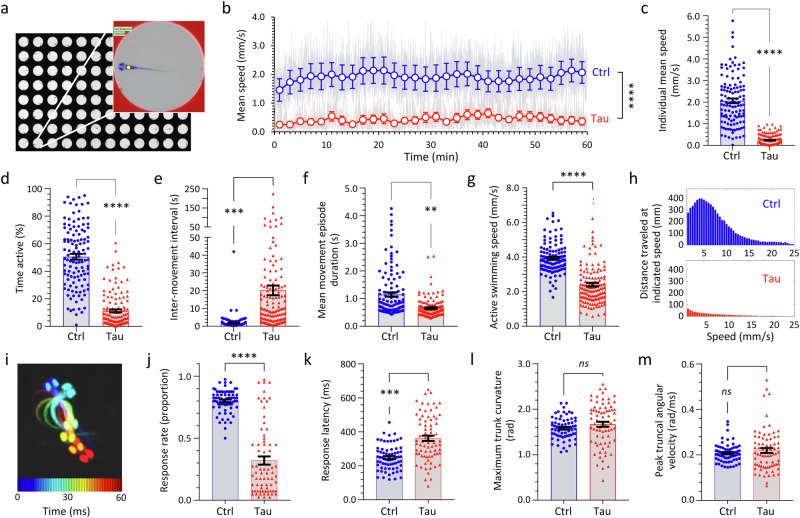
Fig. 5. Hypokinetic motor phenotype in transgenic zebrafish expressing human 4R/0N-Tau.
a–h Zebrafish motor function was evaluated at 5 dpf using automated tracking in 96-well plates35,36 under constant ambient illumination at 28 °C. a Plate image; inset shows features detected by the algorithm (well boundary, red; zebrafish, blue; zebrafish centroid, yellow). b Ctrl and Tau zebrafish (n = 48 each group) were compared in the same 96-well plate. Zebrafish centroid displacement at each video frame transition is scaled for each group to show mean speed (light gray traces). Colored markers (Ctrl, blue; Tau, red) show group mean ± SE within each 2-min time bin. ****p < 0.0001, Ctrl vs. Tau, 2-way repeated measures ANOVA with Šidák multiple comparisons test (Supplementary Table 11). c–h Quantification of motor function in Ctrl and Tau zebrafish (3 combined biological replicates): c mean speed; d % time active; e inter-movement interval; f movement episode duration; g active swimming speed. Data points show individual zebrafish (Ctrl, n = 117; Tau, n = 130), bars show mean ± SE. ****p < 10−15, ***p = 3.1 × 10⁻¹⁰, **p = 5.3 × 10⁻⁸, Ctrl vs. Tau, 2-tailed unpaired t-test with Welch’s correction. h Histogram showing total distance traveled at different instantaneous speeds over the course of the assay. i–m Zebrafish responses to abrupt ambient light-dark transitions were evaluated at 5dpf at 1000 frames/s using a segmentation/kinematics application38. i ‘O’-bend illustrated by superimposing pseudocolored zebrafish silhouettes every 10 ms during the response. j Response rate (proportion of stimuli followed by motion within 1 s); k response latency (mean interval between stimulus and response onset); l maximum trunk curvature during ‘O’-bend response; and m peak truncal angular velocity (maximum rate of change of trunk curvature). Data points in i–m show mean responses of individual zebrafish (Ctrl, n = 68; Tau, n = 74), bars show group mean ± SE. ****p < 10−15, ***p = 7.3 × 10⁻⁹, ns not significant, Ctrl vs. Tau, 2-tailed unpaired t-test with Welch’s correction. Source data are provided as a Source Data file.

