Fig. 4.

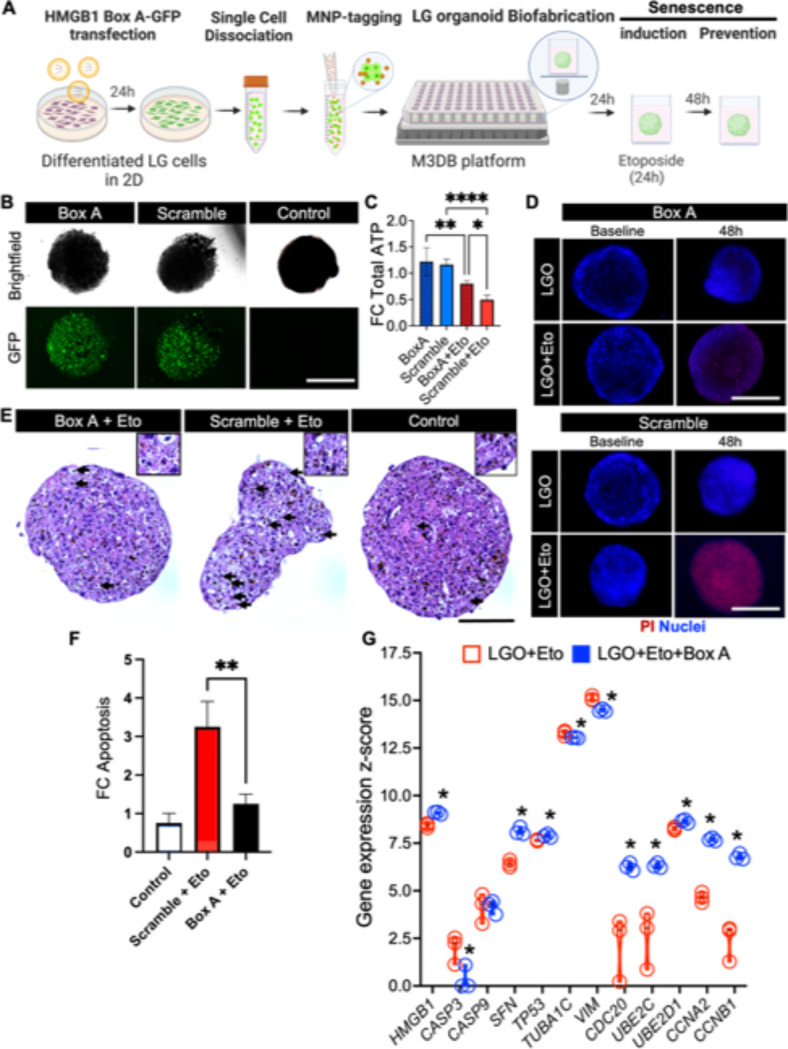
Protection effect of HMGB1 Box A gene therapy against senescence-associated pathogenesis in LG organoids. (A) Biofabrication and experimental steps to test Box A gene therapy to protect a LG organoid against cellular senescence. MNP magnetic nanoparticles. Created with BioRender.com. (B) Fluorescence micrographs of GFP-conjugated High Mobility Group A Box-1 domain plasmid (Box A), GFP-scramble plasmid (scramble) transfected organoid and LGO-treated vehicle control to confirm transfection protocol for subsequent gene therapy. (C) Total ATP was detected by CellTiter-Glo 3D assay in normal (Eto-free) LG organoids transfected groups Box A and Scramble, and the Eto senescence-induced transfected groups, Box A + Eto and Scramble + Eto. *p < 0.05, **p < 0.01, ****p < 0.0001 using a one-way ANOVA with Tukey post-hoc test (n = 3–4). (D) Cell death in all four LG organoid transfected groups was determined by PI staining counterstained with nuclear Hoechst. (E) H&E micrographs of senescence-induced LGO with Box A and scramble plasmid (Box A + Eto and Scramble + Eto, respectively), and LGO-treated vehicle control (control) are performed to identify cellular changes caused by apoptosis (arrows). Insets are displayed on top with higher magnification and focus. Mag.: 40×, scale bar: 100 μm. (F) Apoptosis (late stage) was quantified after PI staining and fluorescent microscopy imaging and plotted as fold change in fluorescent signal relative to control. Average apoptotic cell values were: 10% for Control group, 32% for Scramble + Eto, and 13% for Box A + Eto). **p < 0.01 using a one-way ANOVA with Tukey post-hoc test (n = 3–4). (G) Expression of genes related to gene therapy target (HMGB1), apoptosis (CASP3, CASP9), DNA repair (SFN, TP53), autophagy via cytoskeletal reorganization (TUBA1C, VIM), autophagy via ubiquitination (CDC20, UBE2C, UBE2D1), cell cycle progression (CCNA2, CCNB1) assessed by nCounter transcriptome panel. Z-score was determined via nSolver software analysis by a comparison with a predefined set of 6 reference genes, where *p < 0.05 using multiple Student t-tests (n = 3). All adjusted p-values are listed on Supplementary Table S5.
