Fig. 5.

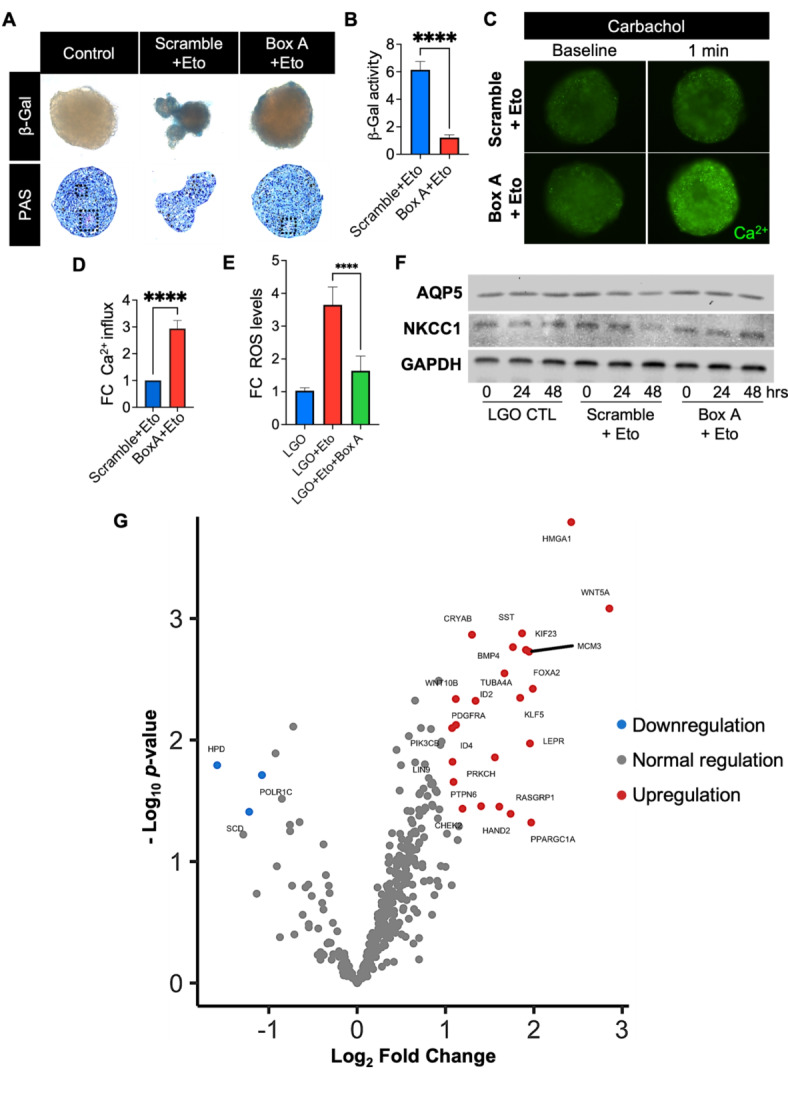
Protection against cellular senescence after Box A gene therapy in LG organoids. (A) Brightfield micrographs of whole-mount staining of senescence-associated β-galactosidase (β-gal) activity and Period acid-Schiff (PAS) staining in healthy LG organoids (LGO) and senescent-associated organoids exposed to Etoposide (Eto) after scramble or Box A gene therapy. Dashed black lines represent bright magenta regions with mucin deposition in vacuoles. (B) The intensity of β-gal-stained cells was quantified by ImageJ, and data plotted as mean ± SD. ****p < 0.0001 while using Student t-test (n = 3–4). (C) Fluorescence micrographs confirmed the Ca2+ influx and secretory function before and upon cholinergic stimulation with carbachol (1 min). (D) Ca2+-labeled fluorescence signal plotted as a fold change (FC) relative Scramble + Eto group, ****p < 0.0001 while using Student t-test (n = 3–4). (E) Senescence-associated ROS levels were determined by ROS-Glo assay kit, normalized to control naïve LG organoids (LGO) and plotted as fold change (FC). ****p < 0.0001 while using Student t-test (n = 3–4). (F) Western blot displaying expression of AQP5 and NKCC1 pro-acinar proteins at 0 h, 24 h, and 48 h after Box A gene transfer (Box A), scrambled plasmid transfer (Scramble) in etoposide-exposed LG organoids and control naïve LG organoids (LGO). GAPDH was used as a loading control. The grouping of blots was cropped from 3 different parts of the same gel for each protein and exposures are explicit by using white spaces for a clear delineation. The protein content was extracted from 20–30 organoids/group, and which were combined at each group level and loaded into each lane. The blot was run one time for each protein of interest. (G) Differential gene expression between Box A HMGB1 and Scramble plasmid gene therapy in LG organoids was quantified using a nCounter transcriptome panel and nSolver software and plotted with Rosalind software. A list of significant differentially expressed genes was determined by a calculated cut-off filter as dictated by the software. Default settings for the filter are at a fold change of 1.5 for upregulated and 1.5 for downregulated with a p-adjusted value of 0.05.
