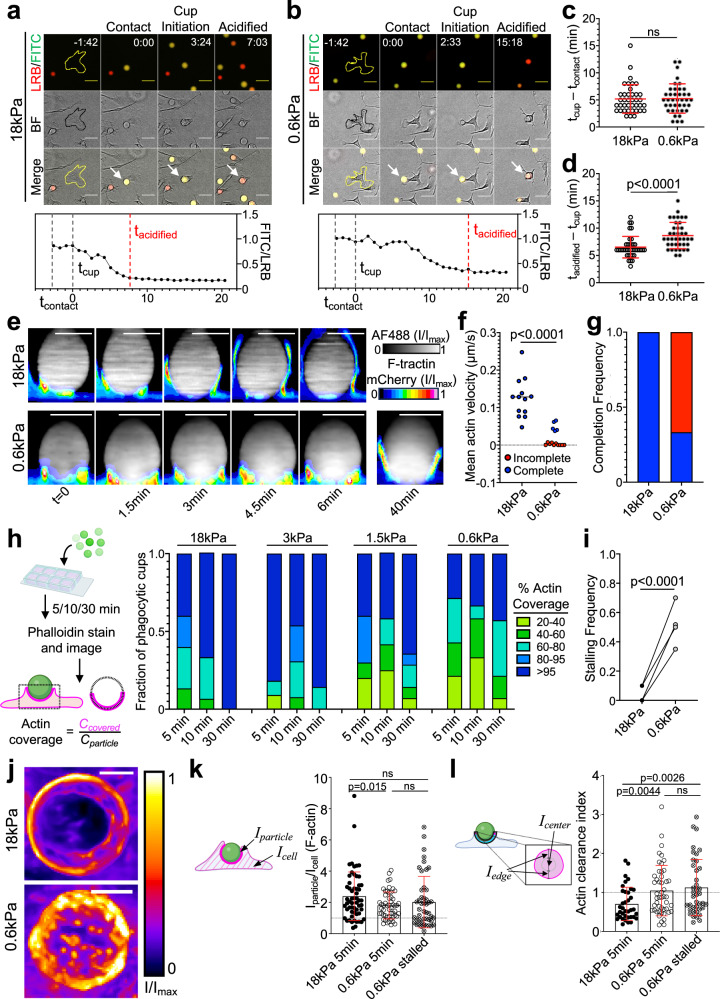
Fig. 3. Phagocytosis of soft targets is slow and prone to stalling.
a–c BMDMs were challenged with 18 or 0.6 kPa IgG-coated DAAM particles and imaged by wide-field videomicroscopy. Above, time-lapse montages showing representative 18 kPa (a) and 0.6 kPa (b) uptake events. Fluorescence (LRB/FITC) and brightfield (BF) channels are shown individually and in merge. Particles undergoing phagocytosis are indicated by white arrows in the merged images. The BMDM of interest is outlined in yellow/black in the first image of each time-lapse. Time is indicated as M:SS in the top right of the fluorescence images, with time of first contact defined as t = 0. Scale bars = 30 µm. c Recognition time, defined as time difference between cup formation and first contact, n = 39 cells. ns not significant, two-tailed Welch’s t-test. d Total acidification time, defined as the difference between particle acidification and cup formation, n = 39 cells. P value determined by two-tailed Welch’s t-test. In (c) and (d), mean values and error bars (denoting SD) are indicated in red. e–g HoxB8-ER macrophages expressing F-tractin-mCherry were challenged with stiff (18 kPa) or soft (0.6 kPa) IgG-coated DAAM particles and imaged by spinning disk confocal microscopy. e Time-lapse montages of representative phagocytic events, visualized as side-views of 3D reconstructions. F-tractin is depicted in pseudocolor, with warmer colors indicating higher fluorescence, and the particle is shown in gray. A 40-min time point from the same 0.6 kPa particle conjugate is included for reference. Scale bars = 10 µm. f Mean phagocytic cup velocity (see “Methods” section and Supplementary Fig. 4d, e) on stiff and soft DAAM particles. Blue and red points denote cups that completed or failed to complete within 30 min, respectively. Statistical significance (p < 0.0001) includes all events, p = 0.0002 using only completed events, two-tailed Welch’s t-test. g Fraction of events that completed (blue) or did not complete (red) within 30 min. Completion defined as actin covering >95% of the particle at any time and persisting until the end of capture. h–i BMDMs were challenged with IgG-coated DAAM particles of different rigidities for various times, and then fixed and stained with phalloidin to visualize F-actin. h Left, Schematic for quantification of percent F-actin coverage on fixed phagocytic cups. Right, F-actin coverage for various particle rigidities, graphed against time. Values are sorted into five bins, with colors denoting the fraction of events falling within each bin. n = 15 events per time/stiffness condition (180 total events) in one representative experiment. i Quantification of stalling frequency, defined as the fraction of events that are 20–95% complete after 30 min co-incubation with BMDMs. n = 4 biological replicates (one mouse per replicate). P value determined by two-tailed paired t-test. j Representative en face maximum z-projections of F-actin in partial phagocytic cups formed on 18 and 0.6 kPa DAAM particles, taken from live imaging experiments. Color scale represents fluorescence intensity values divided by the maximum fluorescence intensity of each image. F-actin accumulation (k), defined as the mean phalloidin intensity at the particle interface divided by the mean phalloidin intensity over the entire cell, and F-actin clearance index (l), which compares F-actin signal at the periphery and the center of the phagocytic cup (see “Methods” section), determined in phagocytic cups formed with 18 kPa (5 min) and 0.6 kPa (5 or 30 min) DAAM particles. In (k) and (l), error bars denote SD. P values determined by two-tailed Welch’s t-test. n = 37, 48, 40 cells for 18 kPa, 0.6 kPa 5 min, and 0.6 kPa 30 min, respectively. Schematics in (h), (k), and (l) created with BioRender.com released under a Creative Commons Attribution-NonCommercial-NoDerivs 4.0 International license https://creativecommons.org/licenses/by-nc-nd/4.0/deed.en.

