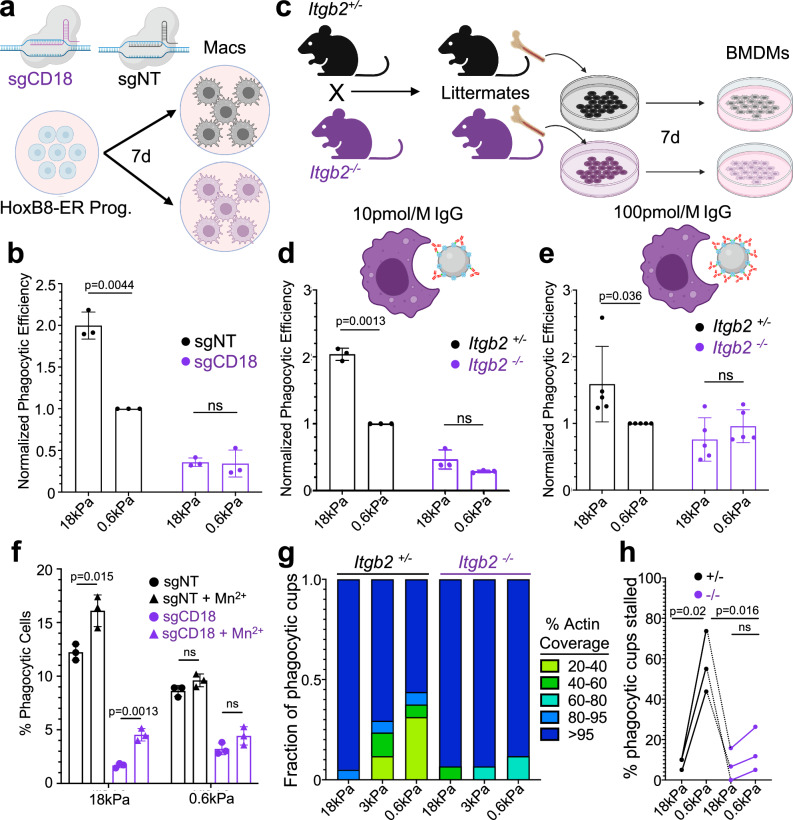
Fig. 5. β2 integrin signaling is necessary for phagocytic mechanosensing.
a Cas9+ HoxB8-ER conditionally immortalized progenitors were transduced with either a non-targeting sgRNA or sgRNA targeting exon 2 of CD18, and then differentiated into macrophages. b sgCD18 HoxB8-ER macrophages and sgNT controls were challenged with IgG-coated 18 and 0.6 kPa DAAM particles. Graph shows normalized phagocytic efficiency, defined as the ratio of percent phagocytic cells relative to the sgNT, 0.6 kPa sample. n = 3 biological replicates from independent differentiations. P values determined by two-tailed ratio paired t-test. ns not significant. c Diagram schematizing the preparation of BMDMs from Itgb2−/− mice. Heterozygous (Itgb2+/−) and homozygous knockout mice (Itgb2−/−) mice were bred and littermate F1 offspring of each genotype were compared in each biological replicate. Itgb2−/− BMDMs and Itgb2+/− controls were challenged with 18 and 0.6 kPa DAAM particles coated with 10 pmol/M (d) and 100 pmol/M (e) IgG. Graphs show phagocytic efficiency normalized against the Itgb2+/−, 0.6 kPa sample. n = 3 biological replicates for each genotype. P values determined by two-tailed ratio paired t-test. ns not significant. f Phagocytic efficiency of HoxB8-ER derived macrophages challenged with 100 pmol/M IgG-coated DAAM particles for 1 h, in the presence or absence of 500 µM MnCl2 added at the start of incubation. n = 3 independent macrophage differentiations. P values determined by two-tailed unpaired Student’s t-test. g F-actin coverage after 30 min incubation, determined for Itgb2−/− BMDMs and Itgb2+/− controls. Values are sorted into five bins, with colors denoting the fraction of events falling within each bin. Representative bars from one biological replicate are shown, from 20 events/condition. h Fraction of events that were 20–95% complete after 30 min co-incubation of DAAM particles with BMDMs. n = 3 biological replicates (litter-mate pairs, 20 events per condition/replicate). P values determined by two-tailed paired t-test. All error bars denote SD. Schematics in (a) and (c–e) created with BioRender.com released under a Creative Commons Attribution-NonCommercial-NoDerivs 4.0 International license https://creativecommons.org/licenses/by-nc-nd/4.0/deed.en.

