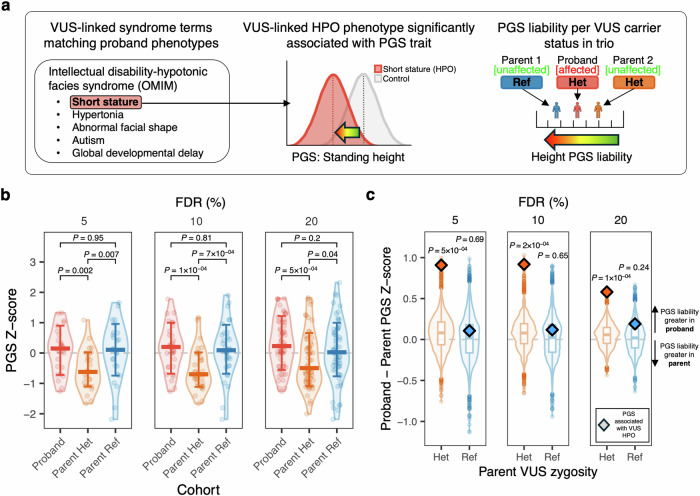
Fig. 3. Differences in trio polygenic liability for probands with an inherited VUS.
a Proposed model of variable rare disease penetrance for inherited candidate pathogenic variant (VUS) in proband and unaffected carrier parent as a function of polygenic liability for an associated complex trait PGS. b Distribution of PGS for probands, carrier (Het) parents, and non-carrier (Ref) parents. PGS with association direction of effect less than zero are inverted to enable visualization. Results are stratified across HPO-PGS significance (FDR) thresholds (from right to left: FDR 20%, 10%, 5%). Cross bars indicate median, error bars indicate standard deviation. P-values are from Wilcoxon Rank Sum test (two-sided). No adjustments were made for multiple comparisons. Results are from 62 HPO:PGS associations across 6 trios (i.e. proband, mother, father) for FDR threshold 20%, 33 HPO:PGS associations across 5 trios for FDR threshold 10%, and 26 HPO:PGS associations across 4 trios for FDR threshold 5%. c Proband minus parent PGS Z-score/standard deviation for significantly associated PGS in probands with a clinical variant of unknown significance (VUS) compared to carrier (Het) and non-carrier (Ref) parents. Points above zero indicate PGS liability is greater in probands and points below zero indicate PGS liability is greater in indicated parent. Pairwise differences for PGS with association direction of effect less than zero are inverted to enable visualization. Diamonds denote median PGS for PGS linked with VUS HPO(s) for probands compared to carrier parents (orange) and probands compared to non-carrier parents (blue). Box and violin plots denote distribution of median PGS for randomly selected PGS not associated with VUS HPO(s), where – for boxplots - the middle line corresponds to the median, the lower and upper edges of the box correspond to the first and third quartiles, the whiskers represent the interquartile range (IQR) ×1.5 and beyond the whiskers are outlier points. P-values are derived from the empirical distribution of these background PGS (N permutations = 10,000). No adjustments were made for multiple comparisons. Results are stratified across HPO-PGS significance (FDR) thresholds (from right to left: FDR 20%, 10%, 5%). Observed results (indicated by diamonds) are from 62 HPO:PGS associations across 6 trios (i.e. proband, mother, father) for FDR threshold 20%, 33 HPO:PGS associations across 5 trios for FDR threshold 10%, and 26 HPO:PGS associations across 4 trios for FDR threshold 5%.

