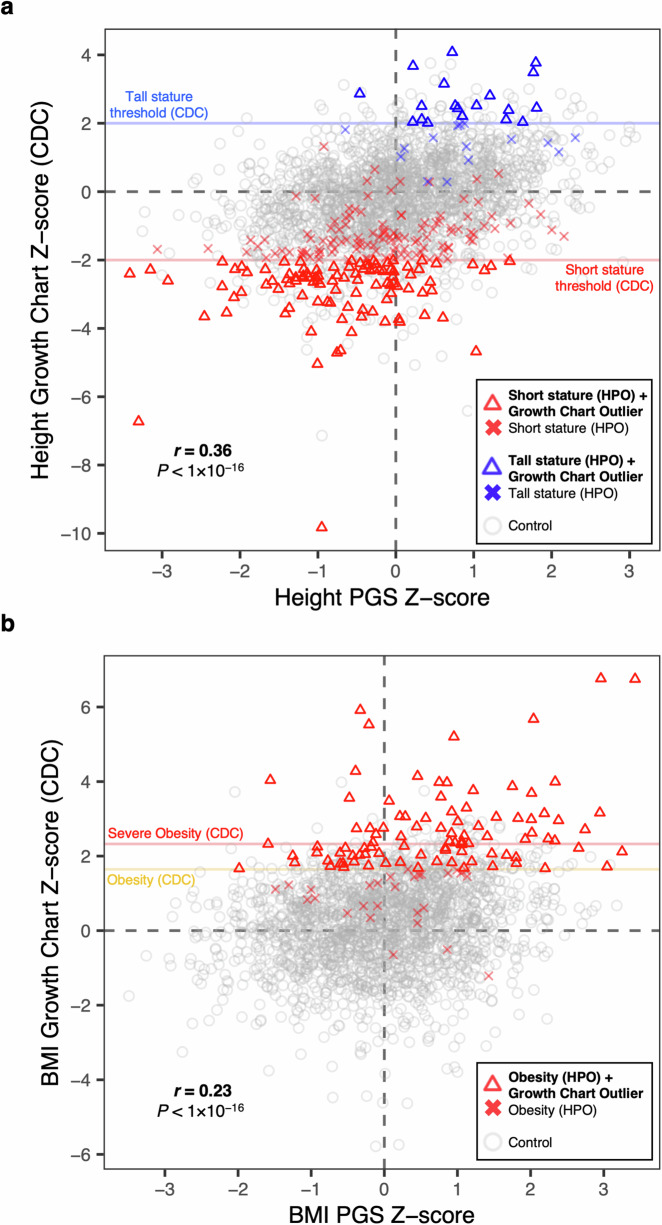
Fig. 4. Integrating PGS and clinical growth chart data.
a Individual height observations indicate age- and sex-adjusted Z-scores (CDC benchmarks) and are displayed on the y-axis. Individual scores for a significantly associated height PGS are displayed on the x-axis. Red horizontal line indicates short stature threshold (CDC). Blue horizontal line indicates tall stature threshold (CDC). Probands with a short stature HPO in GA4K are indicated by a red triangle if observed height value passes CDC threshold for short stature, or a red cross if not passing this threshold. Probands with tall stature HPO are indicated by a blue triangle if observed height value passes CDC threshold for tall stature, or a blue cross if not passing this threshold. Gray indicates control (no short or tall stature HPO terms present in GA4K). Pearson correlation coefficient test (two-sided) and associated P-value is indicated in figure. Pearson correlation coefficient P = 2 × 10−64. b As in (a) for obesity probands compared with controls, and PGS and growth chart Z-scores for body mass index. Pearson correlation coefficient P = 2 × 10⁻²⁶.

