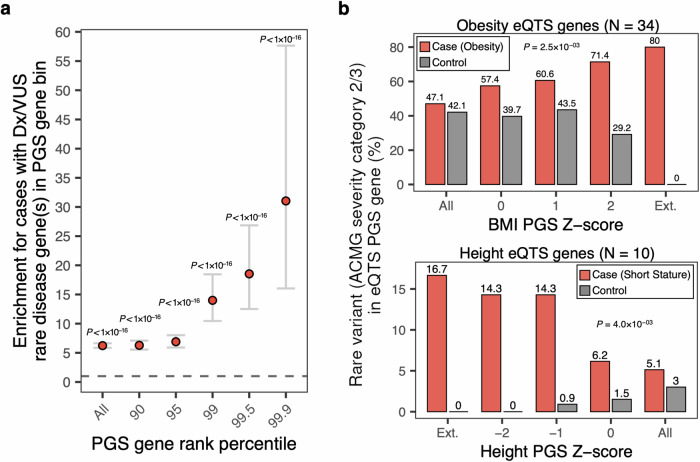
Fig. 5. Quantifying overlap between rare disease variants and putative core/key genes in associated PGS in cases and controls.
a Enrichment for HPO cases versus controls (total N = 538) with a diagnostic or candidate (VUS) rare disease variant in an associated PGS gene with indicated effect rank percentile in PGS. Dots indicate the odds ratio from logistic regression (two-sided), error bars indicate 95% confidence interval. P-values for PGS gene rank percentile: All, P = 0; 90, P = 3 × 10−127; 95, 5 × 10−89; 99, 1 × 10−45; 99.5, 1 × 10⁻³¹; 99.9, 1 × 10⁻¹⁷. No adjustments were made for multiple comparisons. b Proportion of cases (top: obesity cohort; bottom: short stature cohort) and controls with rare variants prioritized in to ACMG severity categories 2 or 3 in trait-relevant eQTS gene as a function of individual liability for significantly associated polygenic scores. P-values are derived from logistic regression (two-sided), testing for an interaction between case/control cohort and PGS Z-score on rare variant burden in indicated eQTS gene set. Ext. denotes maximum outlier PGS cutoff that could be assessed where the cohort contained at least one case with a selected rare variant in an eQTS gene.

