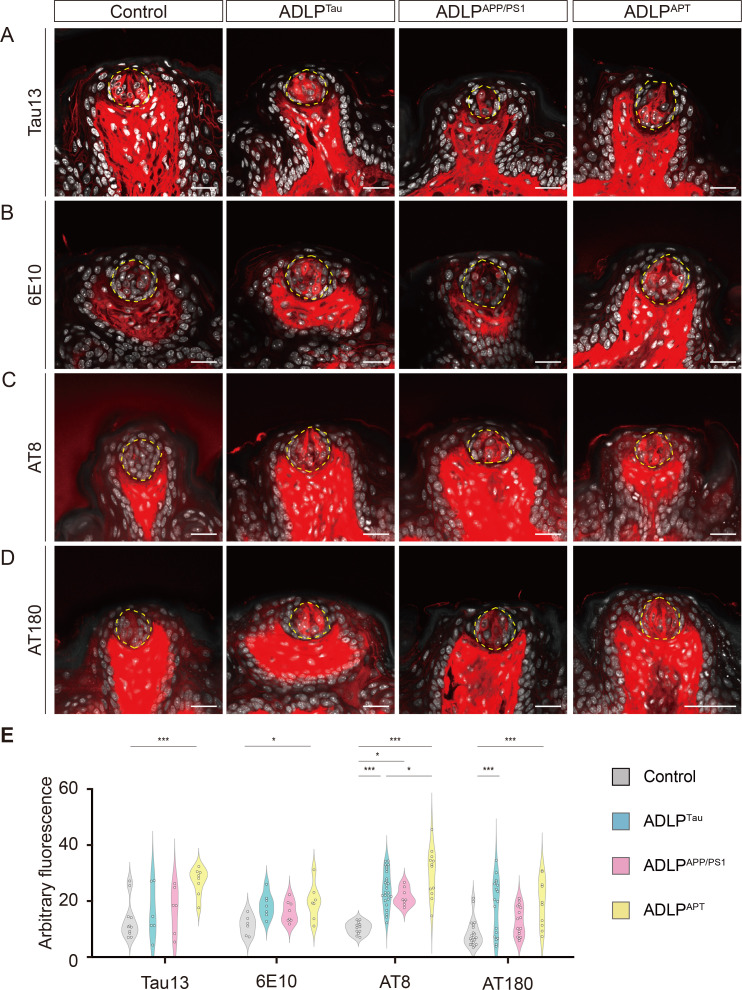
Fig. 4.
Comparison of APP and p-tau in FuP of AD mouse models. Representative images of Tau13-IR (A), 6E10-IR (B), AT8-IR (C), and AT180-IR (D) in control, ADLPTau, ADLPAPP/PS1, and ADLPAPT mice. Yellow dashed lines demarcate the outer boundaries of taste buds. Immunofluorescent signals (red) and DAPI staining (white). Representative images were selected from 3~4 mice per group. Scale bars=50 μm. (E) Intensity quantification for Tau13-IR, 6E10-IR, AT8-IR, and AT180-IR in AD mouse models. *p<0.05, ***p<0.005. Detailed statistical information is available in Tables 4, 5.

