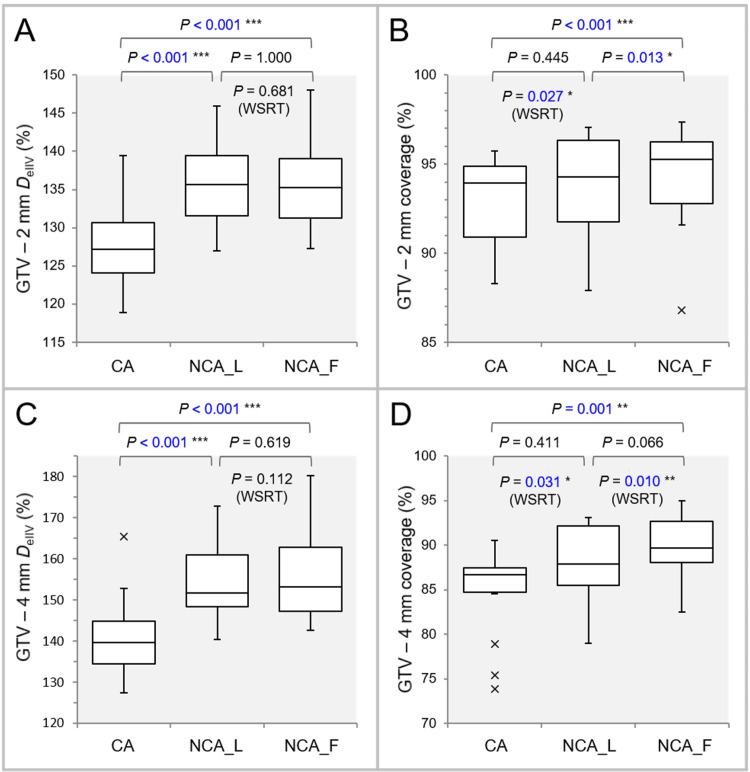
Figure 5. Comparison of the characteristics of the dose gradient inside the GTV boundary.
The images show BWPs along with the results of FT, SPHT, and WSRT (A-D); DeIIV (%) of the GTV - 2 mm (A) and GTV – 4 mm (C), relative to the GTV DV-0.01 cc (100%), to indicate the steepness of dose increase inside the GTV boundary; and the coverage values of the GTV – 2 mm (B) and GTV – 4 mm (D) to demonstrate the degree of concentric lamellarity of dose increase.
GTV: gross tumor volume; GTV - X mm: GTV evenly reduced by X mm; DeIIV: the minimum dose to cover the irradiated isodose volume equivalent to a target volume; WSRT: Wilcoxon signed-rank test; CA: coplanar arcs; NCA_L: non-coplanar arcs with limited rotations; NCA_F: non-coplanar arcs with full rotations; BWPs: box-and-whisker plots; FT: Friedman’s test; SPHT: Scheffe’s post hoc test; DV-0.01 cc: a minimum dose to cover a target volume minus 0.01 cc.

