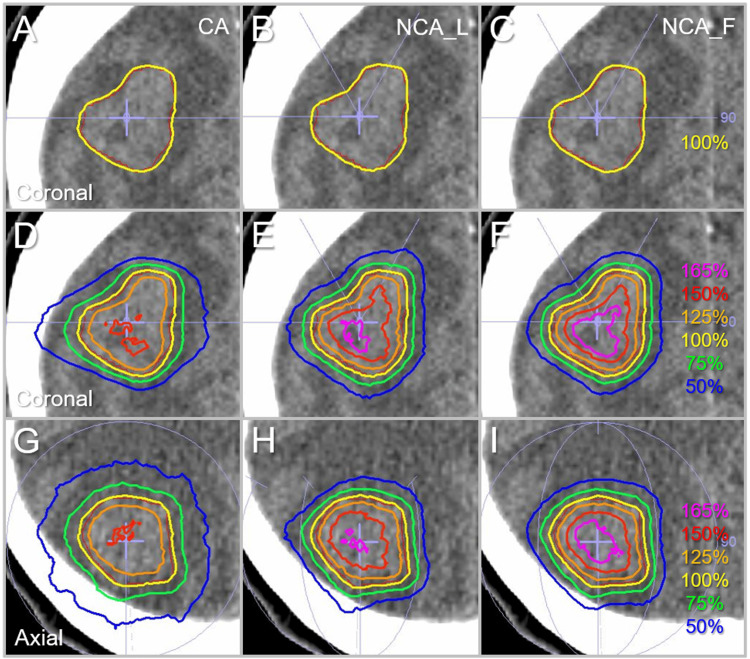
Figure 7. Comparison of the dose distributions for the GTV of 9.54 cc.
The images show head CT images of a patient with a single BM (A-I), onto which the GTV contoured in red, arc arrangements, and representative isodoses are superimposed; coronal views with the most irregular GTV shape (A-F); and axial views (G-I). The isodose lines are shown as relative values with the GTV DV-0.01 cc as 100% (yellow).
GTV: gross tumor volume; CA: coplanar arcs; NCA_L: non-coplanar arcs with limited rotations; NCA_F: non-coplanar arcs with full rotations; CT: computed tomography; BM: brain metastasis; DV-0.01 cc: a minimum dose covering a target volume minus 0.01 cc.

