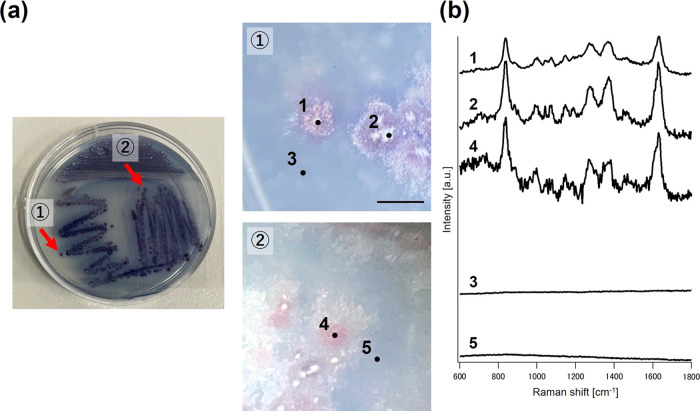
Figure 3.
Microbial colonies of S. coelicolor A3(2) and measured Raman spectra. (a) Overall image of the culture dish and colonies of S. coelicolor A3(2), and stereoscopic images of the colonies. (b) Raman spectra obtained from each point (1, 2, and 4, on the colony; and 3 and 5, on the nonmicrobial area). Scale bar = 1 mm.

