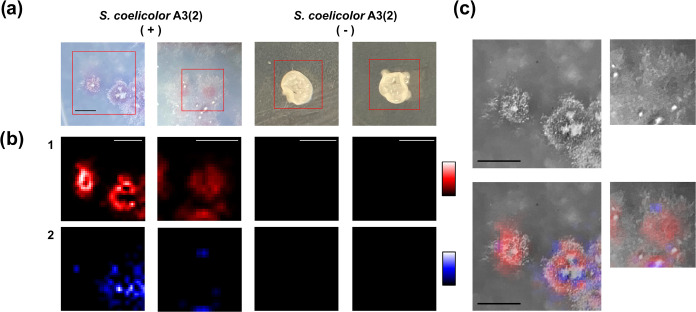
Figure 5.
Raman imaging analysis of S. coelicolor A3(2) colonies on agar dishes. (a) Stereoscopic images of S. coelicolor A3(2) colonies under actinorhodin- and undecylprodigiosin-producing conditions (+) and nonproducing conditions (−). (b) Raman images of (1) undecylprodigiosin and (2) actinorhodin. (c) Overlay of Raman images on black-and-white stereoscopic colony images. Scale bar = 1 mm.

