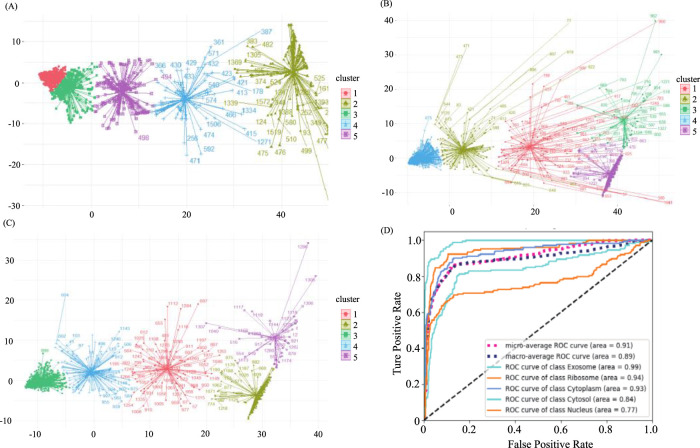
FIGURE 2.
Demonstration of sample distribution at various stages of the balancing process and predictive model results (A). The distribution of the original dataset through K-means clustering. X-axis and Y-axis were projection of the data onto the first dimension of a reduced-dimensional space after using PCA (Principal Component Analysis) (B) The distribution of the balanced dataset through K-means clustering. (C) The distribution of the predictive dataset through K-means Clustering. (D) ROC curve of all categories and averaged cases.

