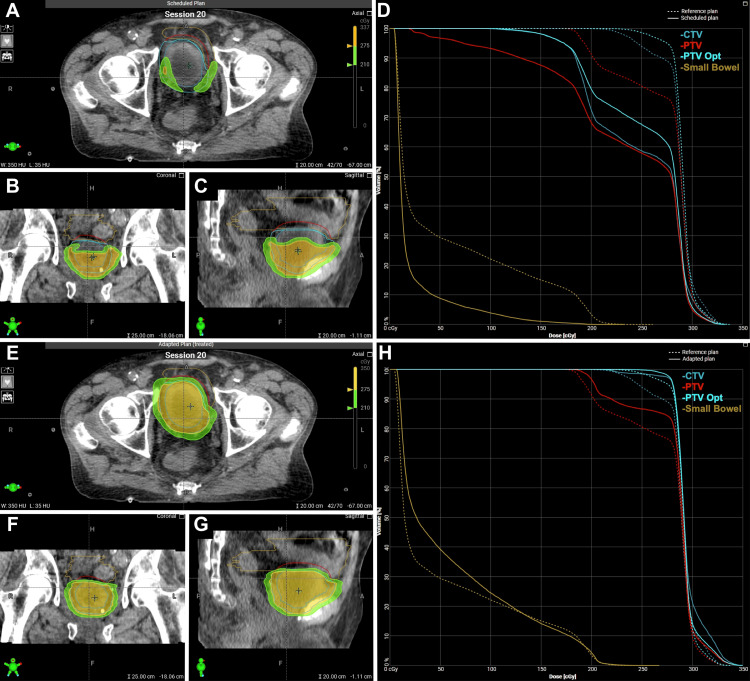
Figure 3. Scheduled and adapted radiation treatment plans for Patient 1.
Axial (A), sagittal (B), and coronal (C) depictions of scheduled plan. Dose-volume histogram (D) of scheduled plan. Axial (E), sagittal (F), and coronal (G) depictions of the scheduled plan. Dose-volume histogram (H) of the adapted plan.
CTV: clinical target volume; PTV: planning target volume; Opt: optimized

