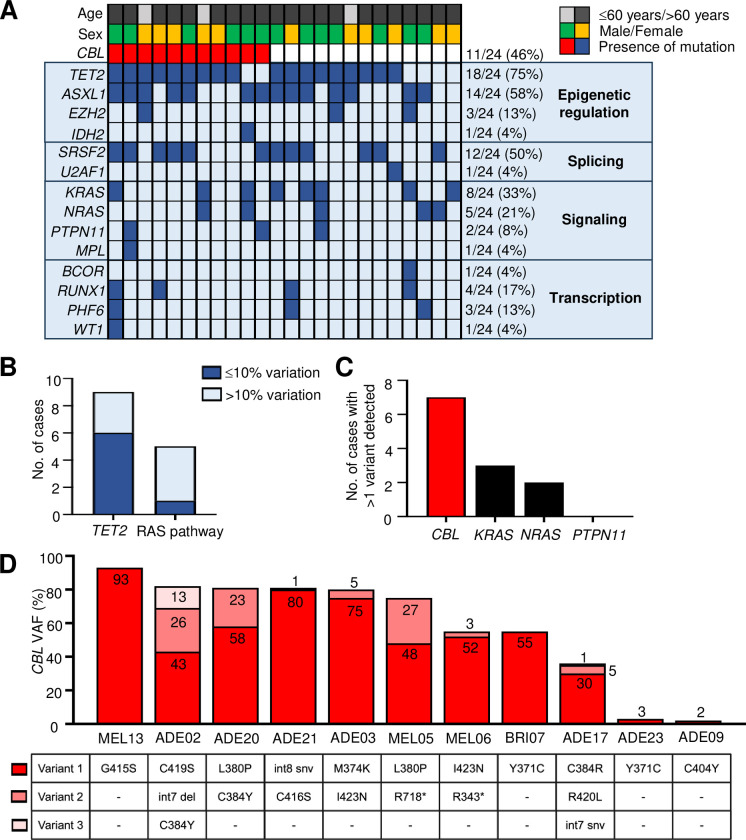
Fig 2. CBL mutants frequently co-occur with TET2 mutants and are associated with a complex subclonal architecture.
(A) Oncoplot for the PREACH-M cohort (n = 24). Mutation groups are shown in rows with each individual patient represented by a column. The presence of a mutation is indicated by the red or blue colored bars. Age category of the patients indicated by the black and grey bars and sex of patients by the green and gold bars. (B) Number of CBL mutant cases where TET2 mutations (n = 9) and other RAS pathway mutations (n = 5) were detected, where variation in the VAF of CBL vs. TET2 or RAS pathway mutant clones were ≤10% (dark blue) or >10% (light blue) (C) Number of cases where more than one variant of CBL, NRAS, KRAS or PTPN11 mutation was detected. (D) Details of CBL variants detected in each patient with CBL mutation. [VAF variant allele frequency].

