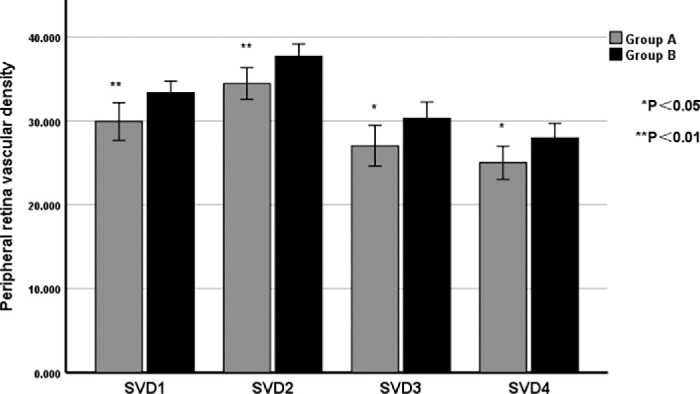
Figure 4.

Comparison of supratemporal (SVD1), supranasal (SVD2), infratemporal (SVD3), and infranasal (SVD4) peripheral superficial vascular density between high and low myopic groups. The statistical method was the t-test and all P values were 2-sided, and P values < 0.05 were considered statistically significant.
