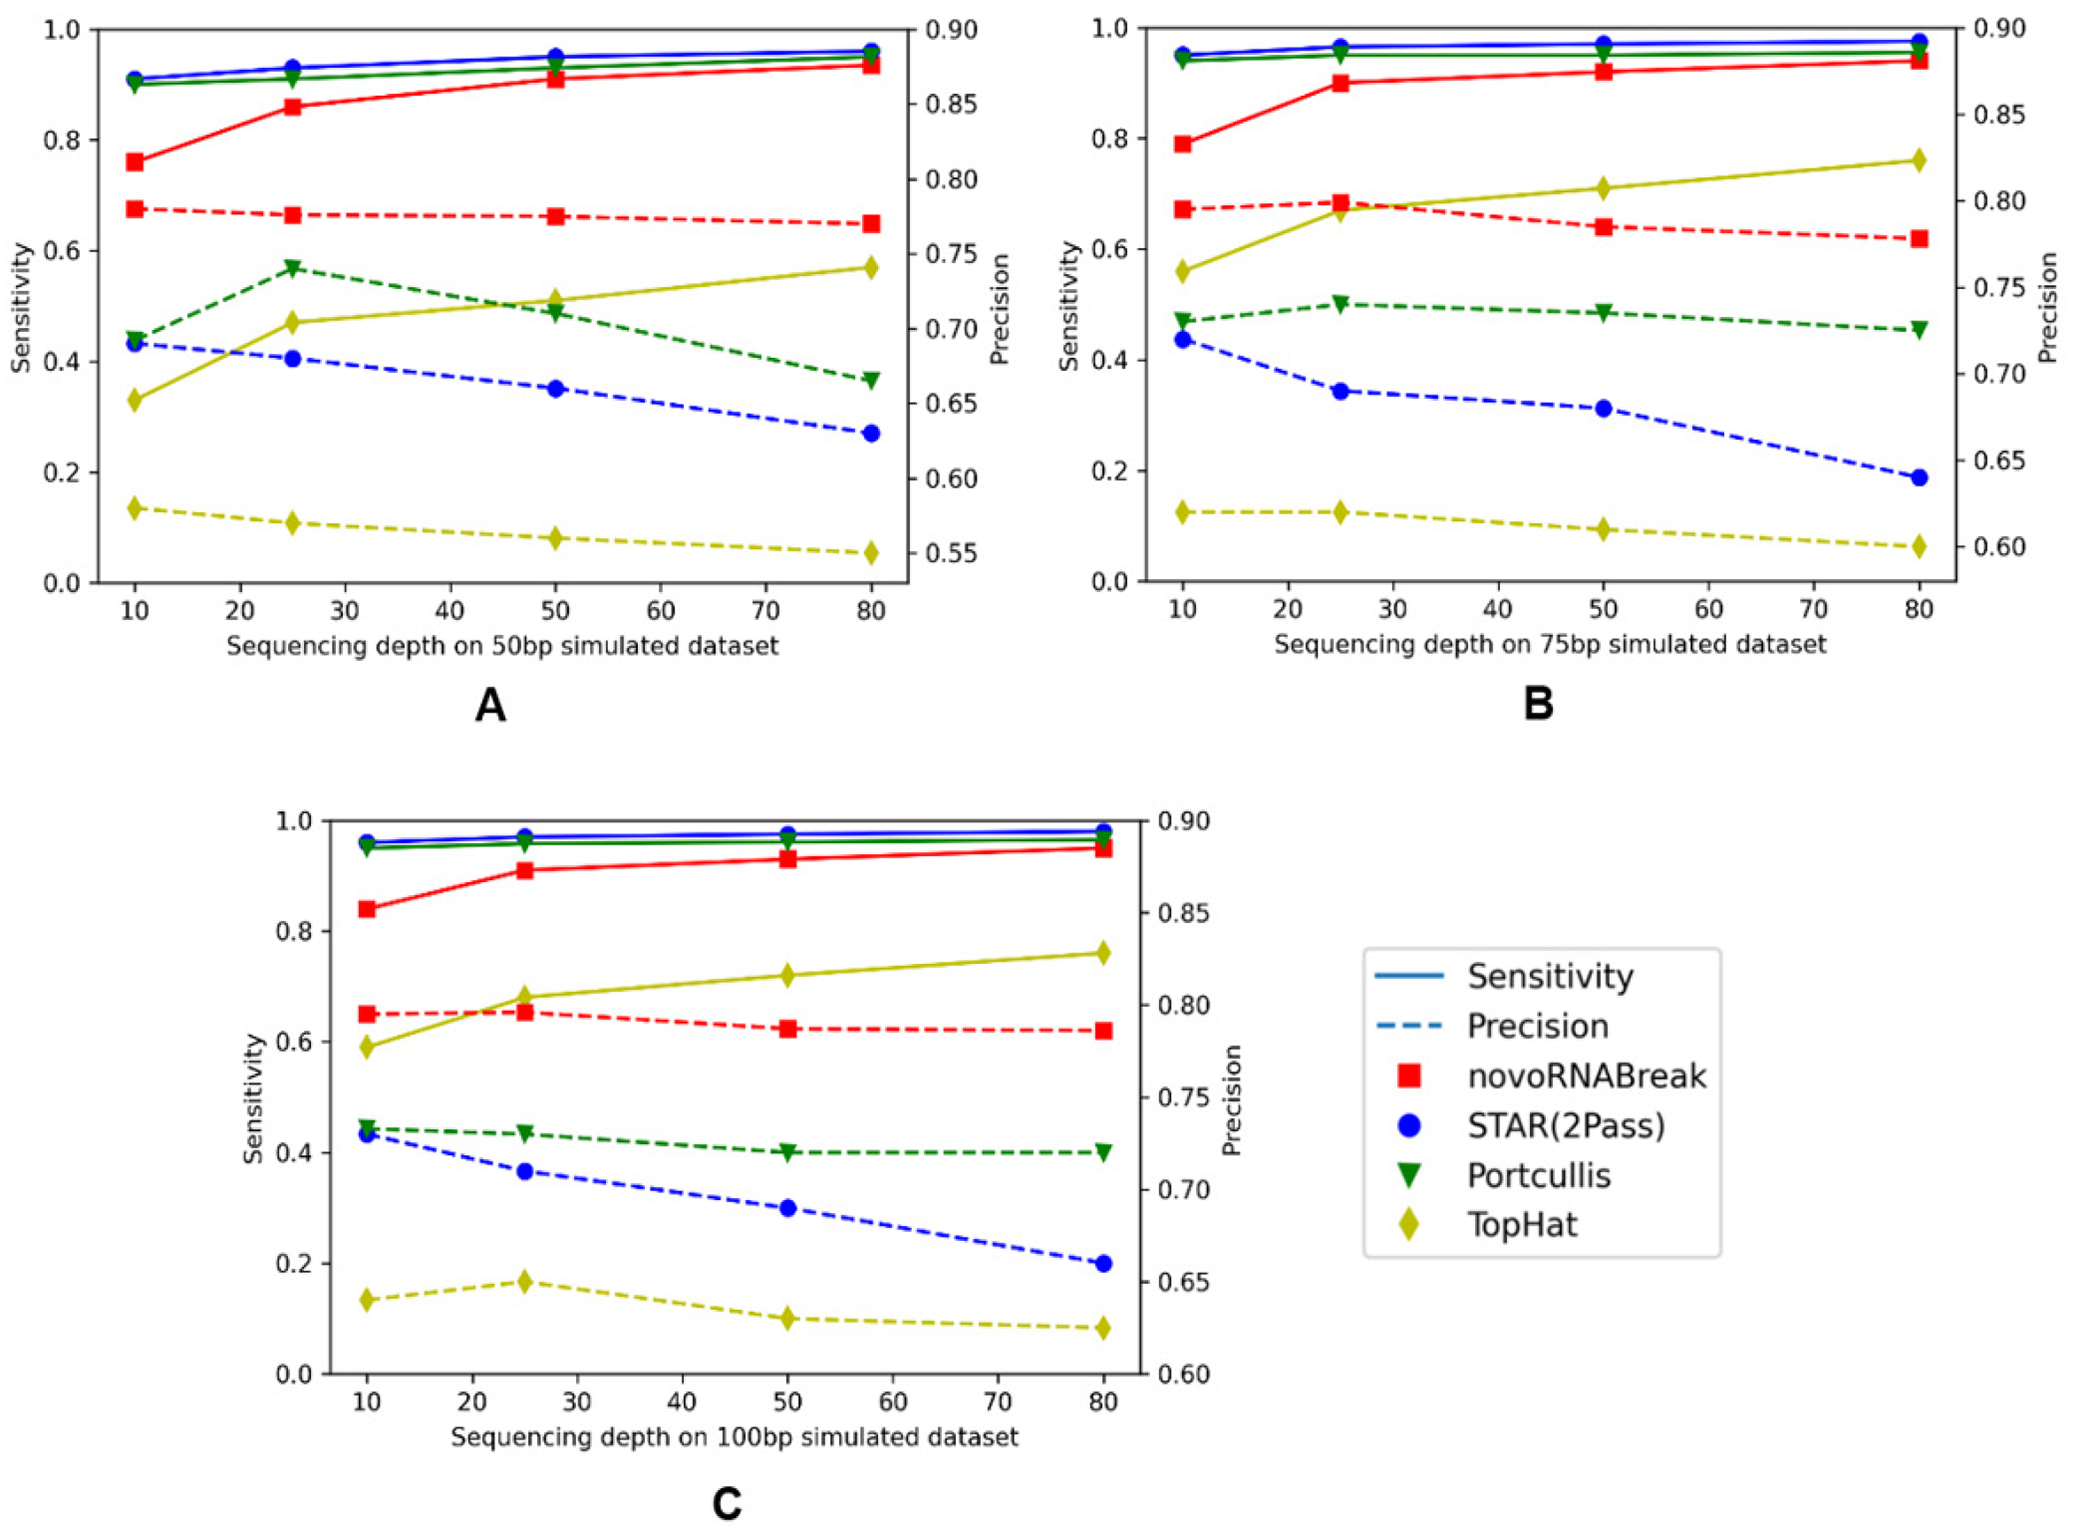
Figure 4:

The novel splicing junction comparison among the novoRNABreak, STAR(2Pass), Portcullis, and TopHat algorithms. The x-axis is the sequencing depth and y-axis is the sensitivity(left) and precision(right). For 50bp reads in (A), 75bp reads in (B), and 150bp reads in (C). The points connected by full lines stand for sensitivity and the points connected by the dashed lines stand for precision.
