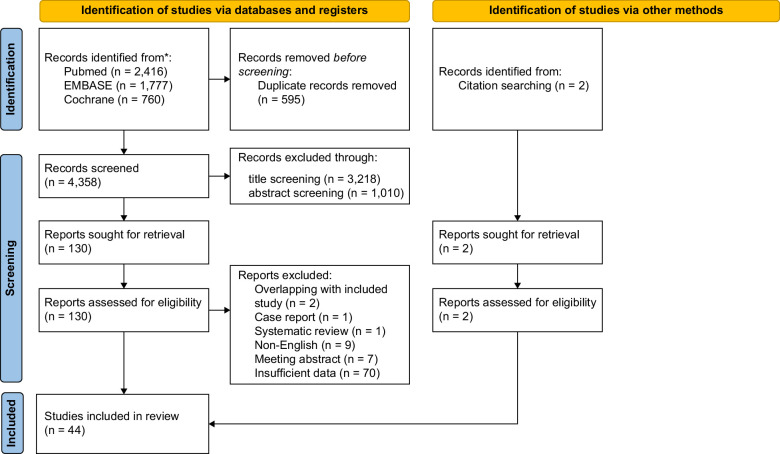
FIGURE 1.
Flow diagram of all included studies. *Consider, if feasible to do so, reporting the number of records identified from each database or register searched (rather than the total number across all databases/registers). **If automation tools were used, indicate how many records were excluded by a human and how many were excluded by automation tools. From Page et al.52 For more information, visit: http://www.prisma-statement.org/.

