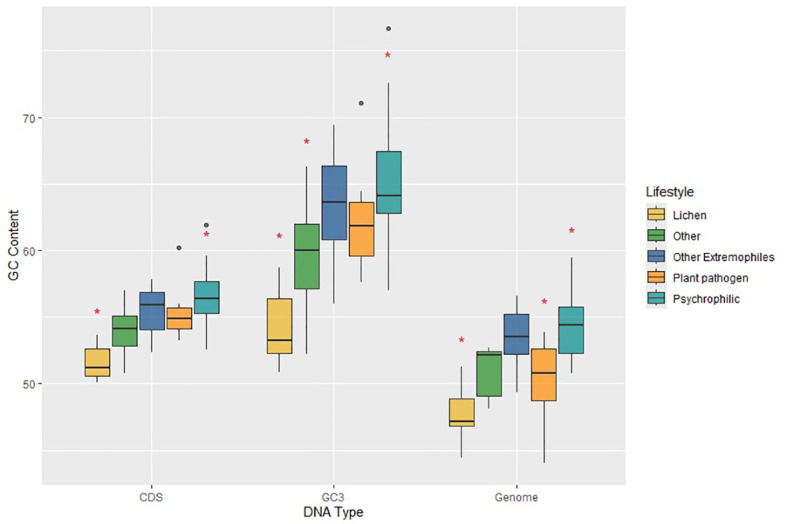
Figure 6.

Plot of GC contents for coding sequences (CDS), third-position bases of genes (GC3) and the total genomes (Genome) for fungi in the different lifestyle groups, which are colored according to the legend on the right. Horizontal lines indicate the means, boxes show the group sizes, the vertical lines represent the range of the data, and the dots are outliers. Red star symbols denote groups with statistically significant differences as determined by Tukey’s HSD test. Lifestyle groups are color coded according to the legend on the right. The category ‘Other Extremophiles’ includes acidophilic, heat tolerant and halotolerant fungi.
