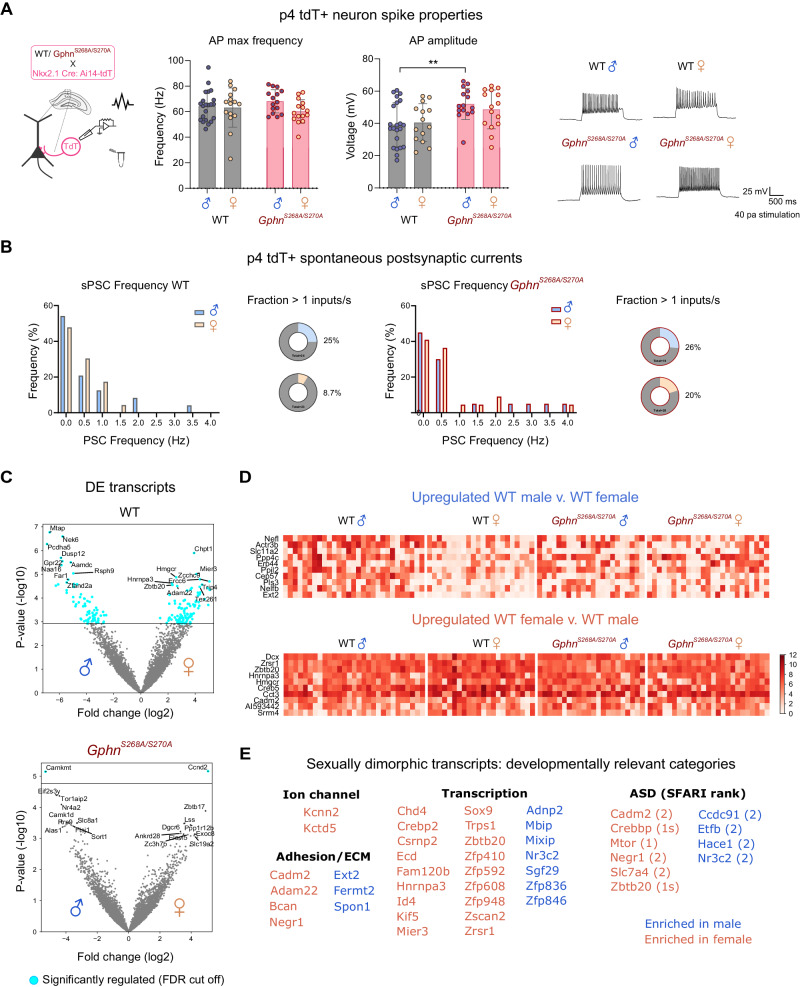
Fig. 6. Patch-sequencing reveals that gephyrin phosphorylation establishes electrophysiological properties and sexual dimorphism of transcriptomic state in developing putative PV CA1 neurons at p4.
Male and female WT and GphnS268A/S270A mice were crossed to Nkx2.1-Cre: Ai14-tdT mouse lines to label putative hippocampal PV neurons with tdTomato at p4 for patch-clamp electrophysiology and single neuron sequencing. A Action potential frequency (left) (Interaction: F(1,63) = 1.398, p = 0.2415; sex: F(1,63) = 2.442, p = 0.1232; genotype: F(1,63) = 0.02019, p = 0.8875), action potential amplitude (right) (Interaction: F(1,62) = 0.6012, p = 0.4411; sex: F(1,62) = 0.1302, p = 0.7195; genotype: F(1,62) = 12.20, p = 0.0009) and representative traces of tdT+ putative PV neurons from dorsal hippocampal slices in the stratum pyramidale at p4. B Spontaneous post-synaptic current (PSC) input frequency histogram and the fraction of neurons receiving inputs at >1 Hz (WT male n = 24, female n = 23, S268A/S270A male n = 19, female n = 20). C Differentially expressed (DE) transcripts between WT and GphnS268A/S270A male and female mice, transcripts in blue represent significant DE transcripts. D Expression heat map of the top 10 most DE sexually dimorphic transcripts up or downregulated in WT male v. WT female mice. E Developmentally relevant categorization of WT sexually dimorphic transcripts. Blue: transcripts elevated in males; orange: transcripts elevated in females. Statistics: Panels A + B: data represent individual cells - WT male n = 22 cells from 8 pups, WT female n = 15 cells from 7 pups, GphnS268A/S270A male n = 5 cells from 9 pups, GphnS268A/S270A female n = 15 cells from 10 pups. Panel C–E – data represent individual cells: WT male n = 29 cells from 8 pups, WT female n = 22 cells from 7 pups, GphnS268A/S270A male n = 22 cells from 9 pups, GphnS268A/S270A female n = 25 cells from 10 pups. Two-way ANOVA with Sidak post-tests **p < 0.01. Panel C see “Methods” section for detailed statistical information. Bars, mean ± SD.

