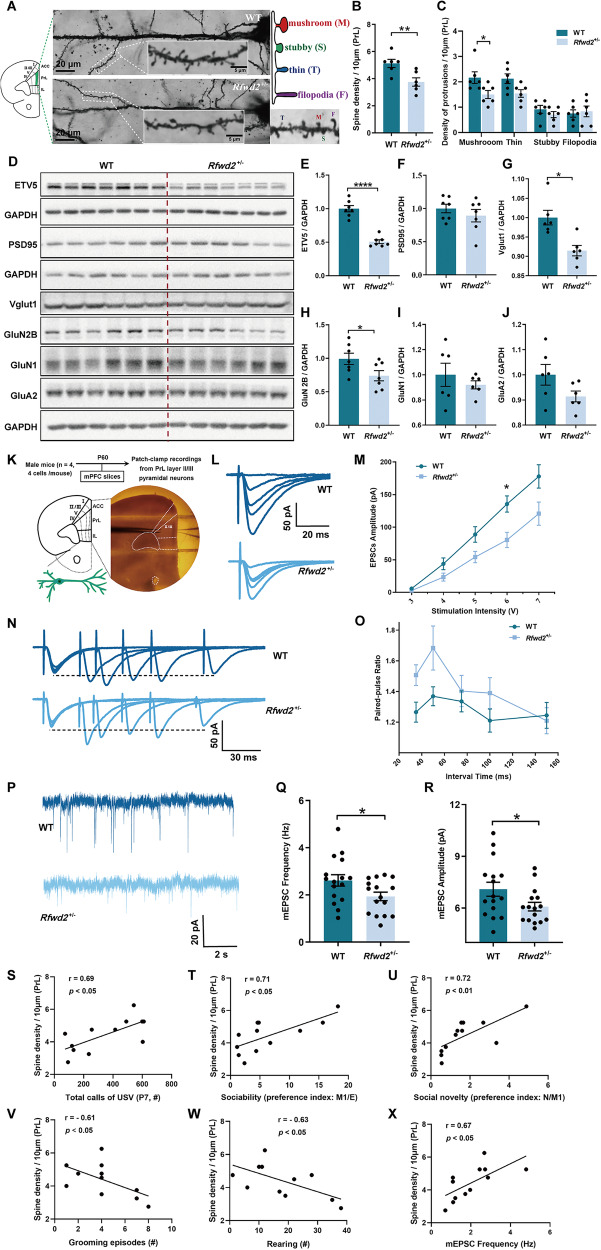
Fig. 4. Rfwd2+/− male mice showed decreases in both spine density and synaptic protein levels, as well as synaptic function deficits.
A Golgi staining of dendritic spines of layer II/III pyramidal neurons in the prelimbic (PrL) area of the mPFC of 2-month-old WT and Rfwd2+/− male mice; diagram and representative image show mushroom, stubby, and thin spines as well as filopodia. B, C There was a decrease in spine density and the number of mushroom spines on the PrL layer II/III pyramidal neurons in Rfwd2+/− male mice compared to male WT littermates. D–J Western blot analysis showed significant decreases in Etv5, Vglut1, and GluN2B levels without significant changes in PSD95, GluN1, or GluA2 levels in the mPFC of Rfwd2+/− male mice compared to WT male littermates. K Diagram showing whole-cell patch-clamp recording on the PrL layer II/III pyramidal neurons from acute mPFC slices. L Representative traces of evoked EPSCs from mPFC slices of male WT and Rfwd2+/− mice. M Average peak amplitude of evoked EPSCs plotted as a function of stimulus intensity from WT and Rfwd2+/− mice. N Representative traces of paired-pulse responses performed in mPFC slices. O Average peak paired-pulse ratio at interstimulus intervals of 35, 50, 75, 100, and 150 ms. P Representative traces of mEPSCs from mPFC slices of WT and Rfwd2+/− mice. Q–R There were significant decreases in the frequency (Q) and amplitude (R) of mEPSCs. S-X. Pearson correlation analysis between spine density and total calls of USV (S), sociability (T), social novelty (U), grooming episodes (V), rearing numbers (W) and mEPSC frequency (X). M, O Two-way RM ANOVA followed by Sidak’s test, others with two-population Student’s t-test. Data are presented as mean ± SEM. *p < 0.05; **p < 0.01, ***p < 0.001. A–J, n = 6–7; K–R, n = 16 cells from 4 WT mice, n = 16 from 4 Rfwd2+/− mice; S–X, n = 6.

