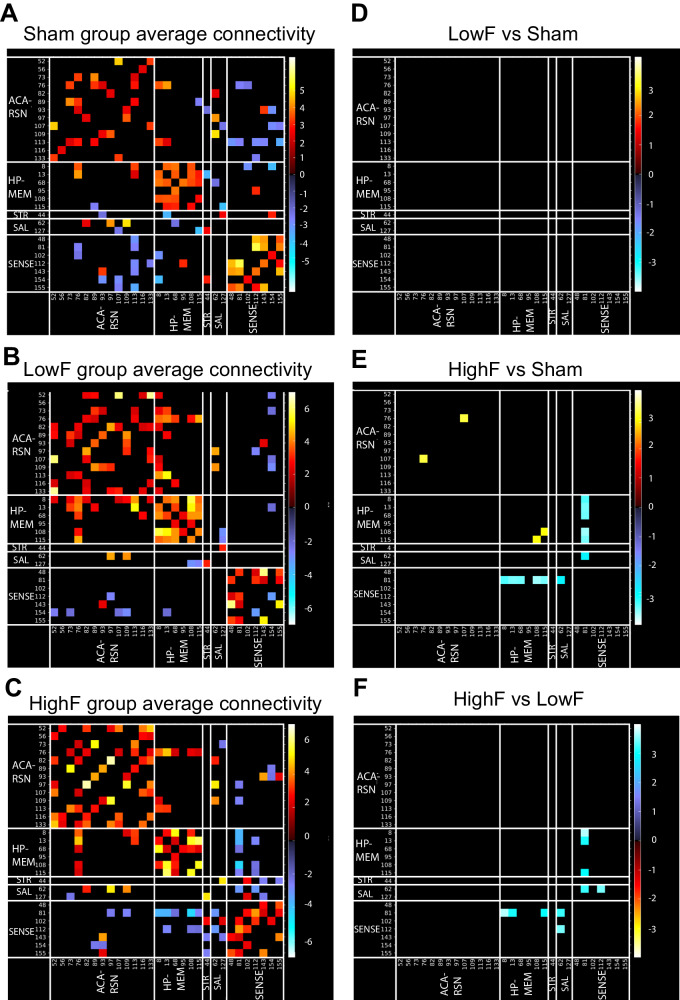
Fig. 4. HighF ultrasound treated mice show differences in averaged resting-state functional connectivity.
Average resting state functional connectivity for selected brain regions for (A) sham treated APP23 mice, (B) LowF treated APP23 mice, and (C) HighF treated APP23 mice. No significant differences in functional connectivity were found when comparing the LowF and sham treated APP23 mice (D); however, HighF treated APP23 mice showed significant differences in functional connectivity when compared to sham treated APP23 mice (E), and LowF treated APP23 mice (F). (Color scaled by Z test statistics; non-black cells were defined as component-component connectivity deemed statistically significant. One sample t-tests, corrected for multiple comparison correction with False Discovery Rate, thresholded at Q < 0.05. Red–Yellow cells: positive correlation. Blue–Green cells: negative correlation).

