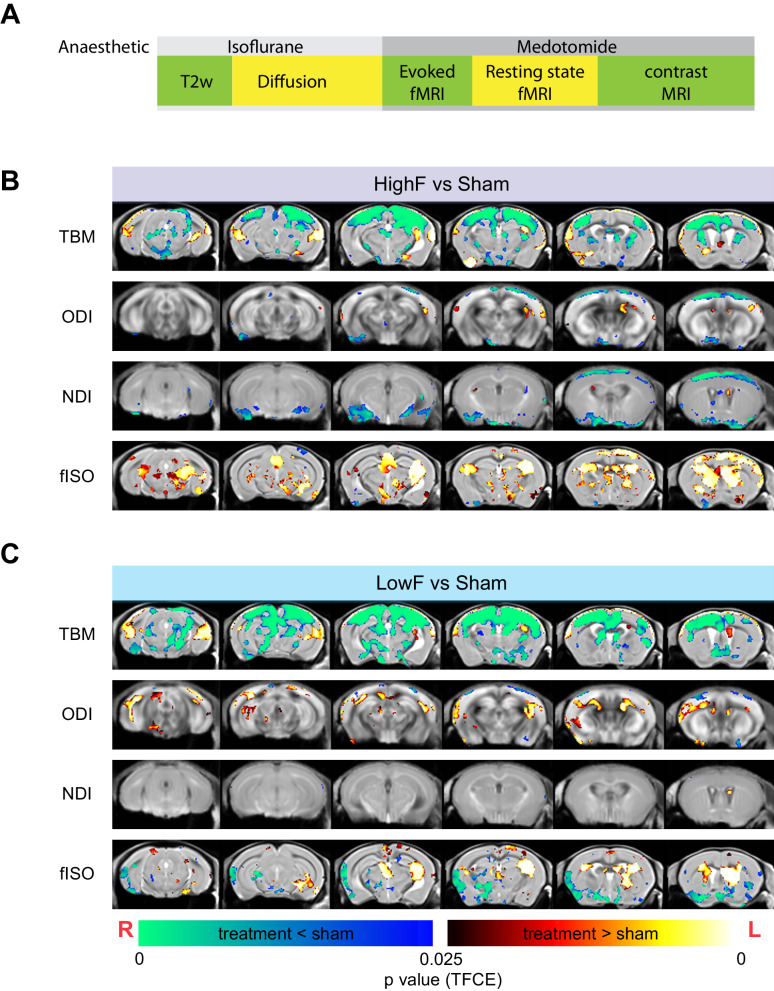
Fig. 5. Changes to brain morphometry and NODDI diffusion measures by group.
A Time-course of MRI and anesthesia. Diffusion MRI reveals structural changes to the brain following HighF (B) and LowF ultrasound treatment (C). Red–yellow voxels show significant increases comparing treatment to sham, and blue–green voxels indicate significant reductions when comparing ultrasound treatment to sham. Tensor-based morphometry (TBM) visualized voxels that underwent statistically significant changes indicative of volumetric effects in HighF treated APP23 mice. Neurite orientation dispersion and density imaging (NODDI) revealed changes in neurite density index (NDI), orientation dispersion index (ODI), and isotropic diffusion volume fraction (fISO) obtained from the diffusion model fitting. Similar changes were found in the LowF group. (2 samples t-test results, implemented as randomized test of General Linear Model; statistical maps were corrected for multiple comparisons with Threshold-free Cluster Enhancement (TFCE) at P value < 0.05 (two-tailed). ODI Orientation Dispersion Index, NDI Neurite Density Index, fISO isotropic diffusion volume fraction. Red anatomical orientation indicators: L Left, R Right).

