Fig. 1.
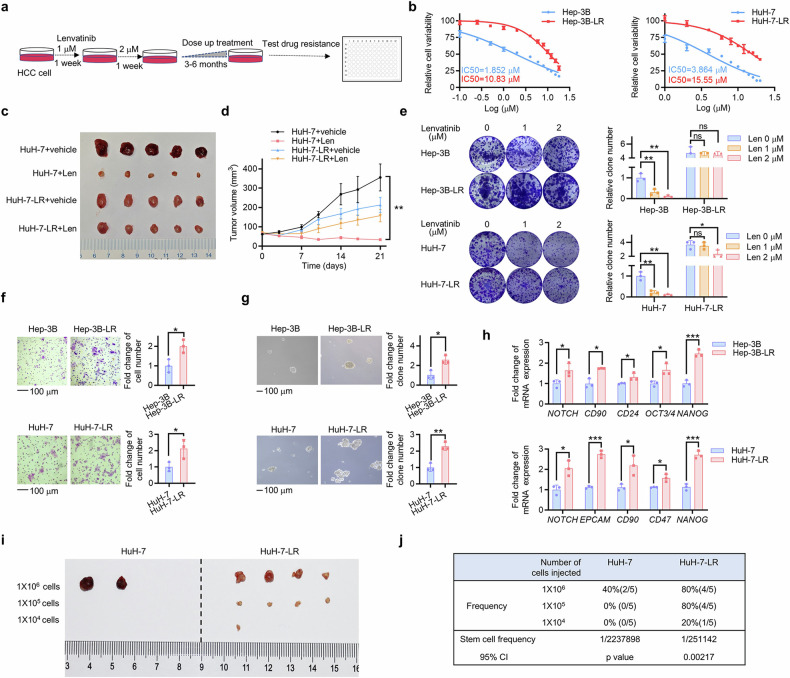
Acquired lenvatinib-resistant HCC cells display increased cancer stemness. a HCC cells were subjected to escalating doses of lenvatinib over a period of 3–6 months in order to develop lenvatinib-resistant cell models. b The IC50 value of Hep-3B, Hep-3B-LR, HuH-7, and HuH-7-LR cells was determined via CCK-8 assay. Each point on the dose-response curves consisted of five replicates. c A vehicle or a Len treatment was administered to nude mice xenografted with HuH-7 cell (lenvatinib, 30 mg/kg) for 3 weeks (n = 5 per group). The isolated tumors were photographed after the mice were sacrificed. d Tumor volume of each group was measured twice a week. e Hep-3B, Hep-3B-LR, HuH-7, and HuH-7-LR cells were treated with the indicated concentrations of lenvatinib. Then, the remaining cells were stained after 2 weeks with crystal violet staining. The colony formations were photographed and counted. Histograms were used to statistically analyze changes. f The migration ability of Hep-3B, Hep-3B-LR, HuH-7, and HuH-7-LR cells was evaluated by transwell assay after incubation for 24 hours. g The sphere formation assay was used to evaluate the in vitro self-renewal ability. h The qRT-PCR assay was employed to measure the mRNA levels of stemness markers. i Limiting dilution xenograft formation of HuH-7 and HuH-7-LR cells in NOD/SCID mice (n = 5 per group). The isolated tumors were photographed, and the stem cell frequency (j) was calculated. Extreme limiting dilution analysis (ELDA) was used for the limiting dilution assay. The data from cell functional assays and RT-qPCR analysis were presented as mean ± SD of three individual experiments, and the data from animal experiments were presented as mean ± SEM. The Student’s t test was used for comparisons. *p < 0.05, **p < 0.01, ***p < 0.001. Scale bar: 100 μm. LR lenvatinib resistant, CCK-8 Cell Counting Kit-8, ns nonsignificant

