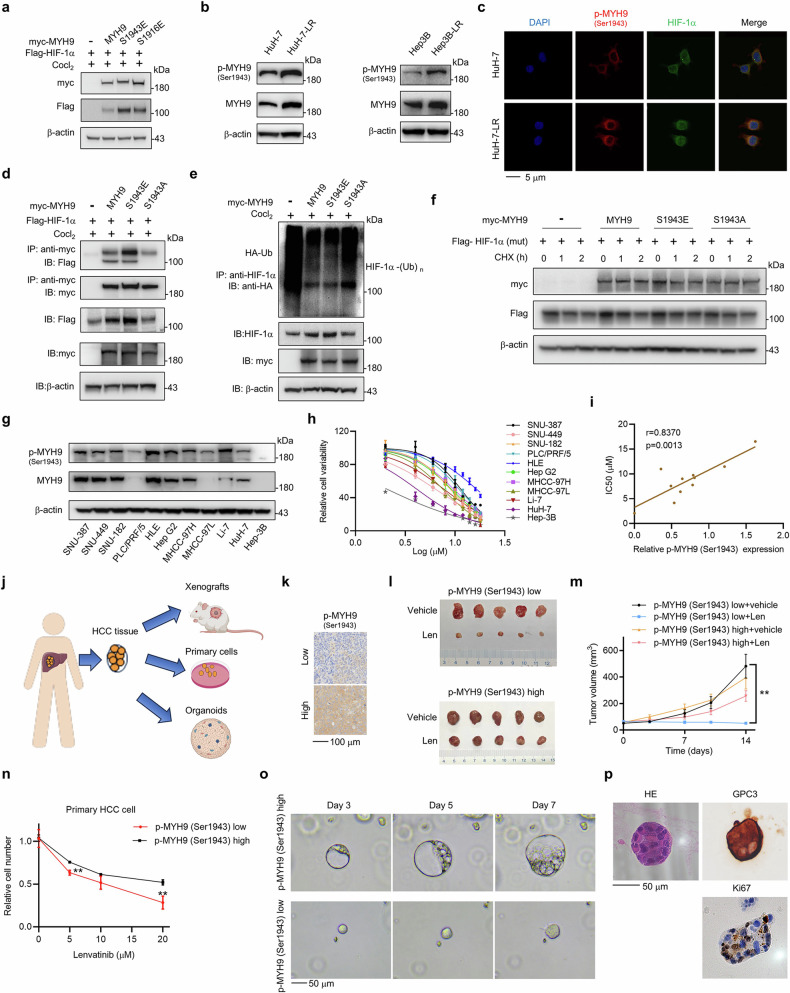
Fig. 5.
Phosphorylated MYH9 at Ser1943 interacts with HIF-1α and promotes LR and stemness in HCC. a HIF-1α (Flag) and MYH9 (myc) plasmids or phosphorylation mimics at S1943 (S1943E) and S1916 (S1916E) were transfected into HEK-293T cells. Anti-myc antibody was used to detect MYH9, and anti-Flag antibody represented HIF-1α. b The expression of p-MYH9 (Ser1943) in WT and LR HCC cells was detected using western blotting. c Colocalization of HIF-1α (green) with p-MYH9 (Ser1943) (red) was observed by confocal microscopy in HuH-7 and HuH-7-LR cells. The nuclei were stained with DAPI. Scale bar: 5 μm. d HIF-1α interactions with MYH9, MYH9-S1943E and its dephosphorylation mimic (MYH9-S1943A) were tested. Vector (–), MYH9 (wt) and its mutants (myc-tag) were transfected into HEK-293T cells respectively along with HIF-1α plasmid (Flag-tag). The immunoprecipitation assay was conducted to isolate myc-tagged vector and MYH9 protein, and anti-Flag antibody was used to detect bound HIF-1α protein. The expression of Flag-HIF-1α, myc-MYH9 and β-actin in whole cell lysates was verified. e MYH9, MYH9-S1943E and MYH9-S1943A (myc-tag) were transfected into HEK-293T cells respectively along with Ub plasmid (HA-tag). The immunoprecipitation assay was conducted to isolate endogenous HIF-1α and anti-HA antibody was used to detected bound Ub. The expression levels of HIF-1α and my-tagged MYH9 in whole cell lysates was verified. f Vector (–), MYH9 (wt) and its mutants (myc-tag) were transfected into HEK-293T cells respectively along with mutated HIF-1α (P402A, P564A) (HIF-1α (mut)) plasmids (Flag-tag). 10 μg/mL CHX was added at the designed time. Western blot was used to assess the expression of HIF-1α and MYH9. g The expression of p-MYH9(Ser1943) and MYH9 in multiple HCC cell lines was analyzed by western blot. h The IC50 of multiple HCC cell lines was measured by a CCK-8 assay to determine cell viability. Each point on the dose-response curves represents five technical replicates. i The correlation between IC50 and the relative p-MYH9 (Ser1943) protein expression was examined. j Schematic of the construction of PDXs, primary cells and PDOs models from human HCC tissues. Created with BioRender.com. k Selection of patients with high and low expression of p-MYH9 (Ser1943) were detected by IHC. Scale bar: 100 μm. l NOD/SCID mice bearing PDX with high and low expression of p-MYH9 (Ser1943) were treated with vehicle or lenvatinib for 2 weeks (n = 5 per group). The isolated tumors were photographed. m Tumor volume of each group was measured twice a week. n Primary cells with high or low expression of p-MYH9 (Ser1943) were treated with lenvatinib under different concentrations for 48 hours in vitro. Alive cell numbers of each group were counted. Relative cell number was calculated. o The relative representative bright-field microscopy images of PDO with high or low expression of p-MYH9 (Ser1943) were photographed on Day 3, 5 and 7. p HE staining of PDO and IHC staining of GPC3 and Ki67 in PDO with high expression of p-MYH9 (Ser1943) were detected. Scale bar: 50 μm. The relevance analysis was conducted using Pearson’s correlation. The data of cell functional assays were presented as mean ± SD of three individual experiments, and the data of animal experiment were presented as mean ± SEM. The Student’s t test was used for comparisons. **p < 0.01. MYH9 non-muscle myosin heavy chain 9, WT wild type, LR lenvatinib resistant, HIF-1α hypoxia-inducible factor-1α, HCC hepatocellular carcinoma, CHX cycloheximide, CCK-8 Cell Counting Kit-8, IP immunoprecipitation, PDX patient-derived xenograft PDO patient-derived organoid

