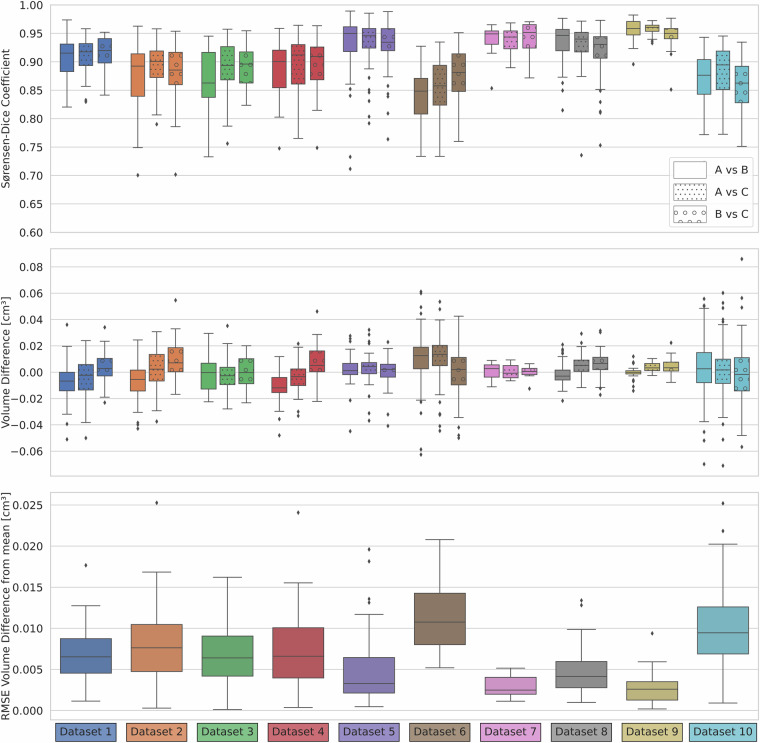
Fig. 2.
Sørensen-Dice coefficient across annotators on each dataset and difference in volume. Each dataset is color-coded, while the annotator pairs are indicated by the hatching: Annotator A vs. B, A vs. C and B vs. C is shown. The middle line is the median, box ends are quartiles, whiskers are 1.5 interquartile range and dots are outliers outside the 1.5 interquartile range. (a) depicts the Sørensen-Dice coefficient, (b) depicts the difference in volume estimation and (b) depicts the root mean squared error between the mean tumor volume estimated from all 3 annotators, and the volume each annotator has estimated. The metrics were calculated over the 3D tumor volumes.

