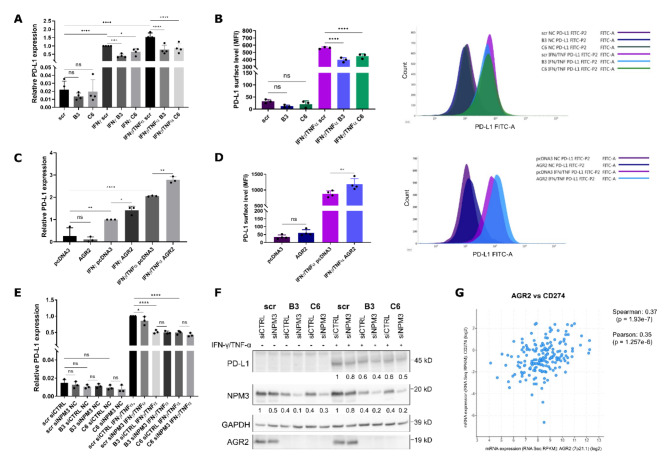
Fig. 4.
AGR2-dependent changes in PD-L1 expression. (A) RT‒qPCR analysis of PD-L1 mRNA levels in SW620 scr cells and its two AGR2-knockout clones B3 and C6 before and after induction with INF-γ alone or in combination with TNF-α after 4 h of treatment. The values were normalised to those of scr IFN-γ and are presented as 2−ddCt mean values ± SD of four biological replicates. GAPDH served as an endogenous control. The results for HPRT1 endogenous control are presented in Supplementary Fig. S7 (A) (B) The surface level of PD-L1 in SW620 cells measured by flow cytometry before and after 16 h of IFN-γ/TNF-α induction. MFI values represent the median fluorescence intensity and are presented as the mean ± SD of three biological replicates. On the right is a representative histogram showing the difference in fluorescence intensities of the analysed samples. The histogram including the respective negative controls is available in Supplementary Fig. S7 (B) (C) PD-L1 mRNA levels in SW480 pcDNA3 and AGR2 cells treated with INF- γ or INF- γ/TNF-α after 4 h. The values were normalized to those of pcDNA3 INF- γ and are presented as 2−ddCt mean values ± SD of three independent replicates. GAPDH served as an endogenous control. The results for the HPRT1 endogenous control are presented in Supplementary Fig.S7 (C) (D) Surface PD-L1 levels in SW480 cells are shown as the mean MFI ± SD of three independent replicates, with a representative histogram on the right. The histogram including the respective negative controls is shown in Supplementary Fig. S7 (D) (E) RT‒qPCR analysis of PD-L1 mRNA levels in SW620 scr cells and its two AGR2-knockout clones B3 and C6 after NPM3 siRNA silencing and 4 h INF-γ/ TNF-α treatment. The values were normalised to those of scr siCTRL INF-γ/ TNF-α and are presented as 2−ddCt mean values ± SD of three biological replicates. GAPDH served as an endogenous control. The results for HPRT1 endogenous control are presented in Supplementary Fig. S7 (E) (F) Representative WB showing the changes in PD-L1 protein levels in SW620 clones and control cells after siRNA-mediated NPM3 and 16 h of INF- γ/TNF-α induction. GAPDH served as a loading control. The graph showing mean ± SD densitometry is presented in Supplementary Fig. S7 (F) The figure shows cropped blots, the originals are presented in Supplementary Fig. S7 (G) * p 0.05, ** p 0.01, *** p 0.001, **** p 0.0001. (G) Correlation analysis of AGR2 and PD-L1 expression in colorectal patient samples represented by Pearson and Spearman correlation coefficients extracted from the cBioPortal database.

