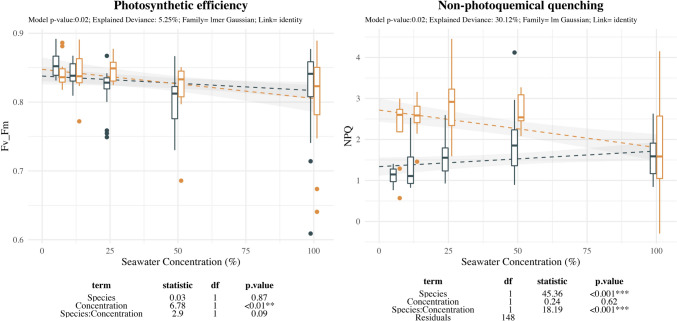
Fig. 7.
Effect of salinity concentration on fluorescence measurements. Boxplots are used to indicate the median and first to fourth quartiles. The dashed line indicates the prediction of the model, while grey area indicates the model standard error. Different colors are used to ease species comparison (blue for E. maritimum and yellow for P. maritimum). Analysis of deviance results are indicated below each plot. For each response variable (Diameter, Length and Number of reproductive structures) the model p-value, the explained deviance and the family of the model are indicated

