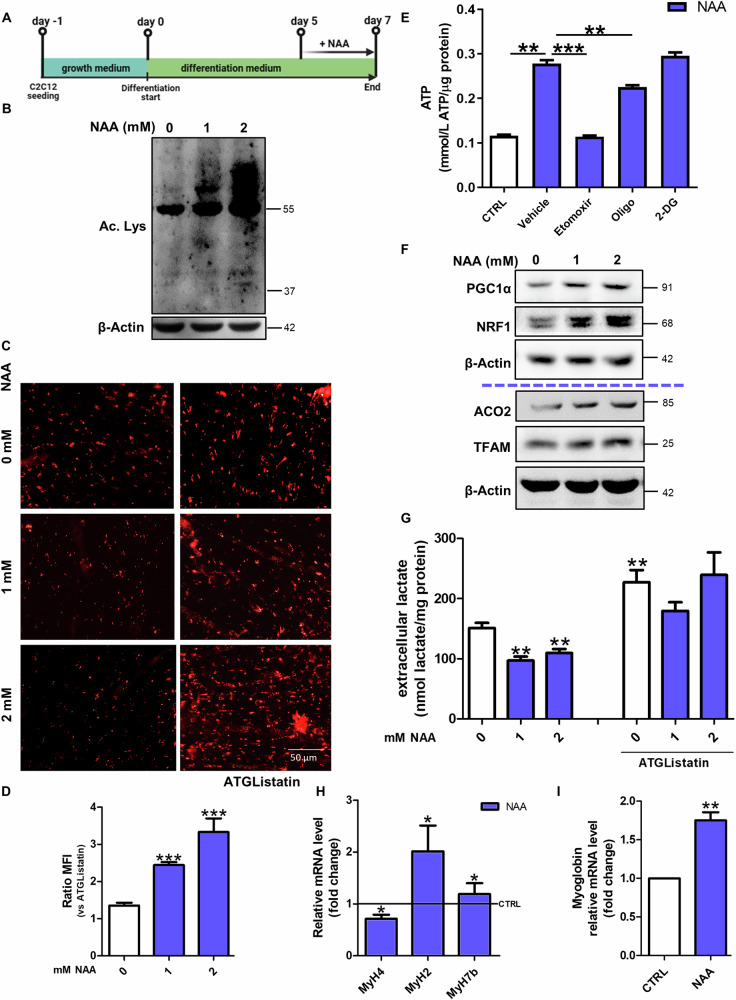
Fig. 1. NAA promotes lipid-dependent oxidative metabolism in myotubes.
A Graphical summary of the experimental design. B Western blot analysis of acetyl-lysine levels. β-Actin was used as a loading control. C Representative images of differentiated C2C12 myotubes after staining with Oil Red-O. Scale bars, 50 µm. (n = 3) D The ratio of MFI of untreated and treated cells with ATGListatin. Data are expressed as mean ± SD of n = 3 independent experiments (***p < 0.001 vs untreated). E Colorimetric quantification of ATP after 2 mM NAA treatment and co-treatment with oligomycin (2 µM), 2-deoxyglucose (40 mM) and etomoxir (20 µM). Data are expressed as mmol of ATP produced per µg of protein. (** p < 0.01¸ *** p < 0.001). F Western blot analysis of PGC1α, NRF1, ACO2 and TFAM levels on C2C12 myotubes. β-Actin was used as loading control. The Western blots reported are representative of three independent experiments that gave similar results. G Evaluation of extracellular lactate content after NAA co-treatment with ATGListatin. Lactate concentration was normalized on total proteins and data are expressed as mean ± SD of n = 3 independent experiments (** p < 0.01 vs 0 mM). RT-qPCR analysis of H MyH4, MyH2, MyH7b and I myoglobin in C2C12 myotubes. ACTB was used as a reference control. Data are shown as fold change ± SD of n = 3 independent experiments (*p < 0.05, **p < 0.01 vs CTRL). CTRL was represented by a straight line in the bar graph.

