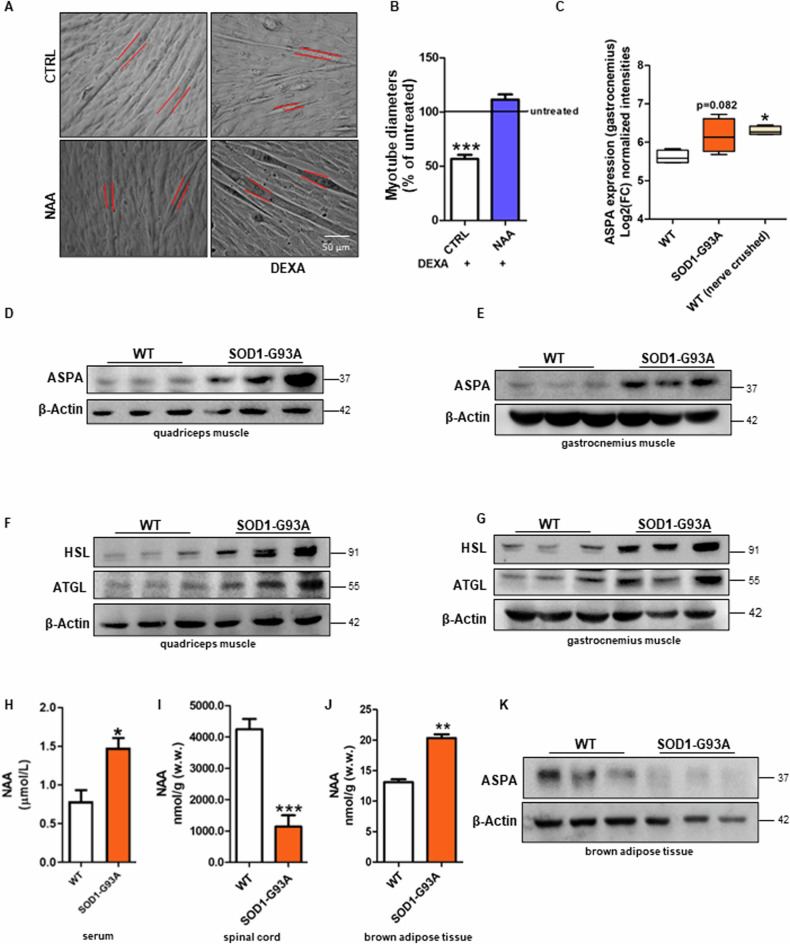
Fig. 4. NAA restrains atrophic response in myotubes and ASPA is upregulated in muscles undergoing atrophy.
C2C12 myotubes were treated with dexamethasone (DEXA) and after 48 h (A) bright field images of myotubes were taken. Scale bars, 50 µm (n = 3). B The diameter measurement was performed by ImageJ software. Data are expressed as mean ± SD of n = 3 independent experiments (*** p < 0.001 vs % of untreated). C Bioinformatic analysis of ASPA expression in gastrocnemius muscle of WT, SOD1-G93A and nerve-crushed mice. Data are expressed as Log2(fold change) ± SD (*p < 0.05 vs WT). Western blot analysis of ASPA, HSL and ATGL levels on (D, F) quadriceps muscle and (E, G) gastrocnemius muscle of symptomatic SOD1-G93A and WT mice. β-Actin was used as a loading control. Determination of NAA concentration in H serum, I spinal cord and J BAT of SOD1-G93A and WT mice by HPLC. K Western blot analysis of ASPA on brown adipose tissue of symptomatic SOD1-G93A and WT mice. β-Actin was used as a loading control. The Western blots reported are representative of three independent experiments that gave similar results.

