FIGURE 5.

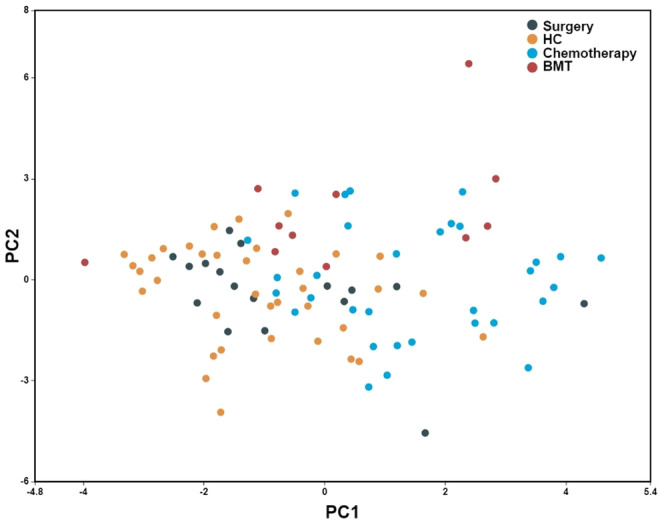
Primary components analysis of cellular populations that showed significant differences between groups. Primary components analysis shows the distribution of cellular populations with significant differences between groups.

Primary components analysis of cellular populations that showed significant differences between groups. Primary components analysis shows the distribution of cellular populations with significant differences between groups.