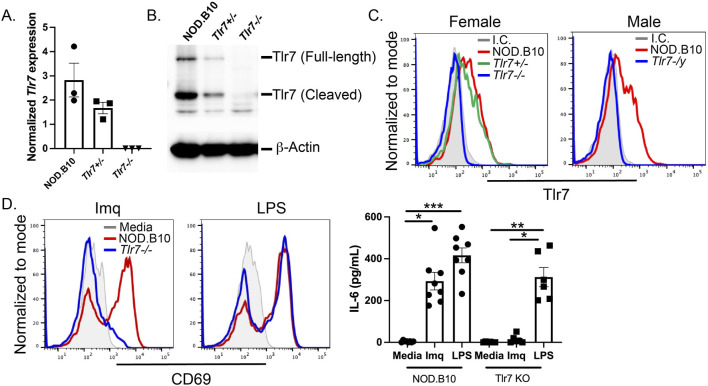
FIGURE 1.
Tlr7 is ablated in male and female NOD.B10 mice. Spleens were harvested from male and female mice and (A) qRT-PCR was performed on female NOD.B10, NOD.B10 Tlr7+/− , and NOD.B10 Tlr7−/− spleens (n = 3 each). (B) Western blotting was performed on male and female mice. Representative data from one female NOD.B10, NOD.B10 Tlr7+/− , and NOD.B10 Tlr7−/− spleen is shown. (C) Flow cytometry was performed to assess expression of Tlr7 in B cells from NOD.B10 (n = 11), NOD.B10 Tlr7+/− (n = 9), and NOD.B10 Tlr7−/− females (n = 13). NOD.B10 (n = 9) and NOD.B10 Tlr7-/y males (n = 9) were also assessed. Representative histogram plots from one animal of each sex and strain is shown. (D) Splenocytes were harvested from NOD.B10 females (n = 6) and NOD.B10 males (n = 2). Spleens from NOD.B10 Tlr7−/− females (n = 3) and NOD.B10 Tlr7-/y (n = 3) mice were also harvested and cultured in media alone, in Imq, or in LPS. Supernatants were harvested and IL-6 was quantified by ELISA. Cells were harvested and CD69 expression was assessed by flow cytometry. Representative histogram plots from one animal of each strain are shown from each treatment condition. Horizontal lines represent mean and standard error of the mean (SEM), (*p < 0.05, **p < 0.01, ***p < 0.0001 for the hypothesis tests described in the statistical section).

