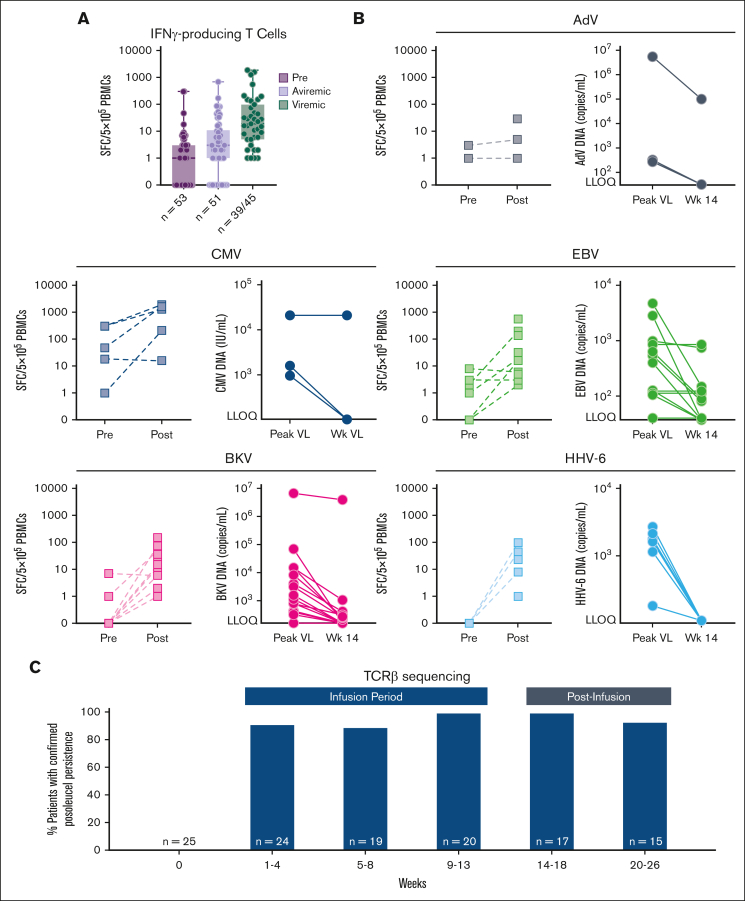
Figure 2.
Viral load (VL), functional virus-specific immune reconstitution, and posoleucel persistence functional immune reconstitution evaluated by ELISpot assay. The frequency of virus- specific IFN-γ+–producing cells (posoleucel and endogenous derived) was evaluated after stimulation of patient peripheral blood mononuclear cells (PBMCs) with AdV, BKV, CMV, EBV, or HHV-6 antigens (spot-forming cells [SFCs] per 5 × 10⁵ PBMCs). (A) ELISpot responses are plotted for all patients (and target viruses) with evaluable data before infusion (Pre; N = 53; mean = 14 SFCs), who were aviremic for a target virus through week 14 (aviremic; n = 51; mean = 28 SFCs), and who were viremic for a target virus through week 14 (viremic, n = 39 of a total of 45 viremic events; mean = 171 SFCs). Box plots show the median with all values plotted. (B) ELISpot responses are plotted for all patients with evaluable data who were viremic for ≥1 viruses during the primary end point. Data shown represent the circulating frequency of IFN-γ+ T cells before posoleucel infusion (Pre) and the peak response through week 14 (Post). VLs are also shown per virus by plotting the peak VL through week 14 (peak VL) and at week 14/last time point available (week 14 VL). VLs from 3 patients with CSIs are excluded (CMV, n = 2; and EBV, n = 1). (C) TCRβ sequencing was used to track presence of TCRβ sequences unique to posoleucel during the infusion period and after (postinfusion). The percentage of patients with detectable posoleucel T cells during each indicated study period are shown.

