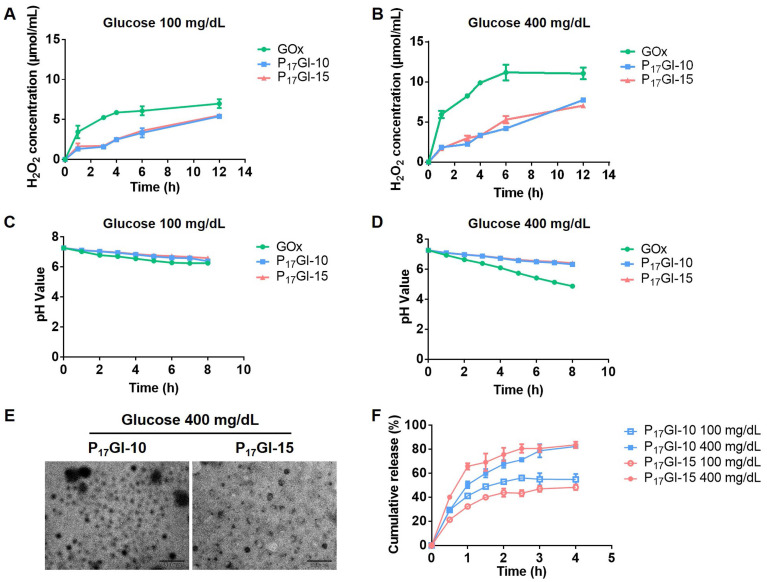
Figure 2.
Glucose-responsive behavior of the dual-sensitive NPs. The concentrations of H2O2 in (A) 100 mg/dL and (B) 400 mg/dL glucose solution after free GOx and PGI NPs incubation. The pH values in (C) 100 mg/dL and (D) 400 mg/dL glucose solution after free GOx and PGI NPs incubation. (E) TEM images of P17GI-10 and P17GI-15 NPs in 400 mg/dL glucose solution. Scale bar: 200 nm. (F) Cumulative insulin release of P17GI-10 and P17GI-15 NPs in 100 mg/dL and 400 mg/dL glucose solution, respectively. Data are presented as the mean ± SD (n = 3).

