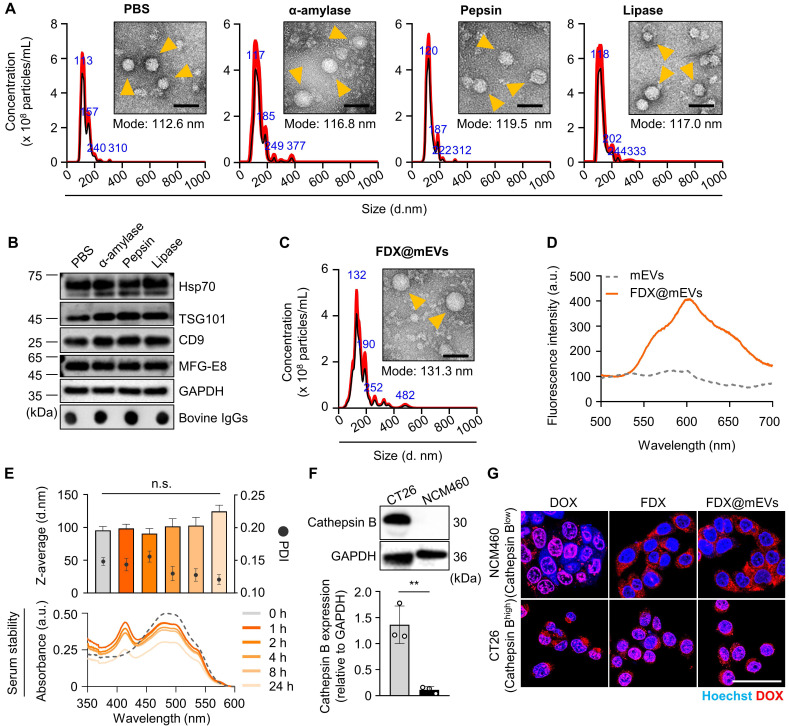
Figure 1.
Preparation and physicochemical characterization of FDX@mEVs. (A) Hydrodynamic size distribution, TEM images of mEVs after incubation in digestive enzymes. Orange arrowheads indicate mEVs. Scale bar: 100 nm. (B) Immunoblotting analysis for detecting EV markers (TSG101, Hsp70, CD9, and MFG-E8), bovine IgG. (C) TEM image and hydrodynamic size distribution of FDX@mEVs. Orange arrowheads indicate FDX@mEVs. Scale bar: 100 nm. (D) Fluorescence spectra of mEVs and FDX@mEVs in the same fraction. (E) Particle size, PDI (upper), and UV-vis spectra (below) of FDX@mEVs complex after serum incubation at various time points (0, 1, 2, 4, 8, and 24 h). (F) Western blotting analysis for assessing cathepsin B expression levels in CT26 and NCM460 cells. (G) Representative fluorescence images showing the internalization of FDX in cell nuclei. Scale bar: 100 μm. All data presented mean ± SD.

