Figure 5.
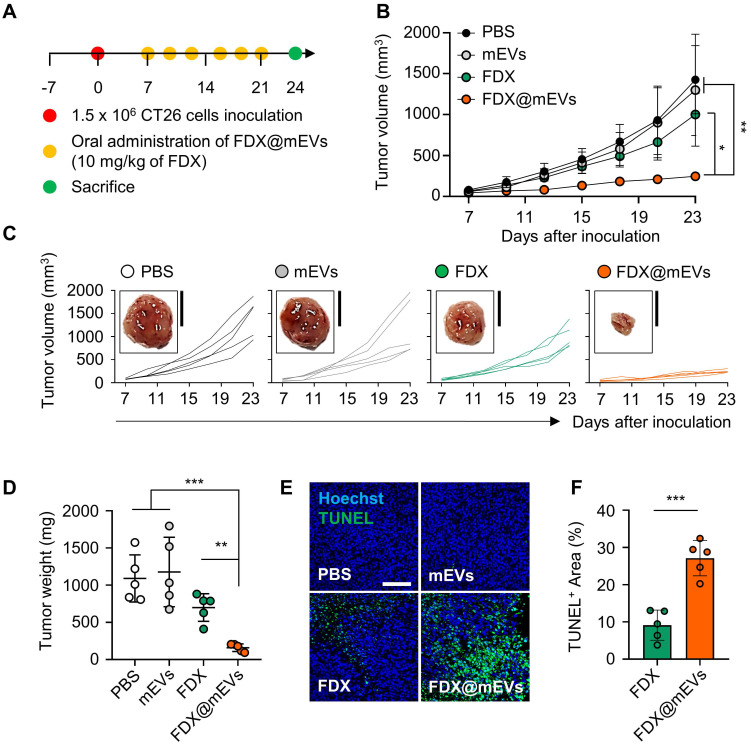
In vivo antitumor efficacy of FDX@mEVs in CT26 tumor-bearing mice. (A) Experimental schedule for in vivo therapeutic effects of FDX@mEVs. (B, C) Tumor growth curves for 18 days after oral administration of each group (n = 5 for each group; black circle: PBS; grey circle: mEVs; green circle: FDX; orange circle: FDX@mEVs). Black solid boxes show representative tumor tissues dissected from all groups. All tumor tissues collected from all mice are presented in Figure S13. Scale bar: 1 cm. (D) Tumor weight was measured after three days of the last administration of all groups. (E, F) A TUNEL assay for confirming apoptotic cells in tumor tissues and quantified graph demonstrating TUNEL-positive area. Scale bar: 100 μm. All data are presented as mean ± SD. n = 5. One-way ANOVA with Tukey's post-hoc multiple comparison and two-tailed t-test, *P < 0.05, **P < 0.01, and ***P < 0.001.

