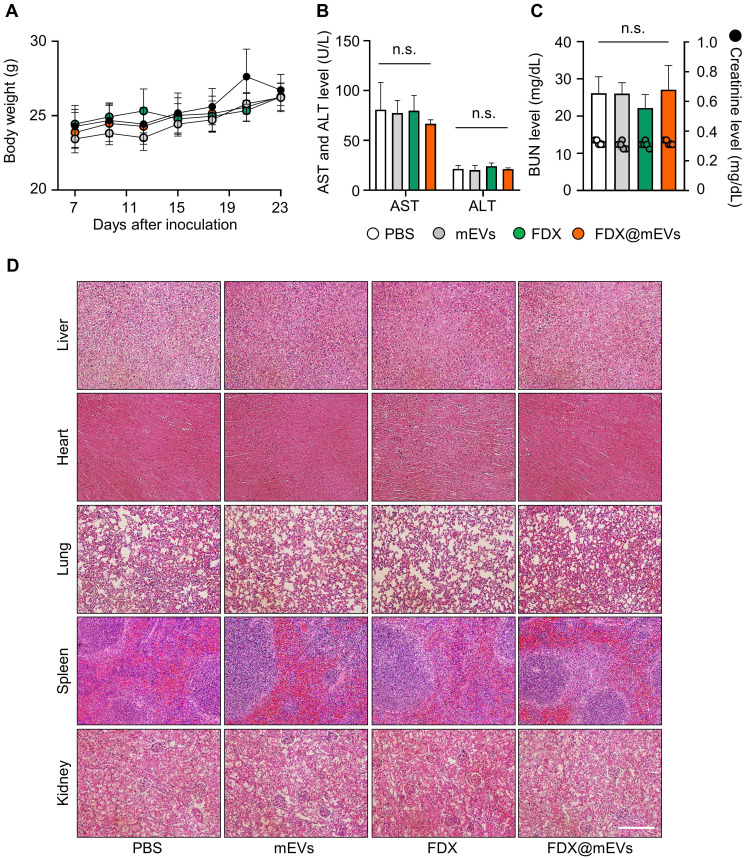
Figure 6.
Systemic toxicity of FDX and FDX@mEVs after oral administration. (A) Body weight changes in mice during multiple administrations of PBS, mEVs, FDX, and FDX@mEVs (n = 5, black circle: PBS, grey circle: mEVs, green circle: FDX, and orange circle: FDX@mEVs). (B, C) Blood analysis for evaluating hematological parameters, such as AST, ALT, BUN, and creatinine. Bar graphs and dots indicate the BUN level and creatinine level, respectively in (C). (D) Representative H&E images of major organs (liver, heart, lung, spleen, and kidney). Scale bar: 100 μm. One-way ANOVA with Tukey's post-hoc multiple comparison, n.s.: not significant.

