. 2024 Sep 18;32(10):1637–1648. doi: 10.32604/or.2024.052664

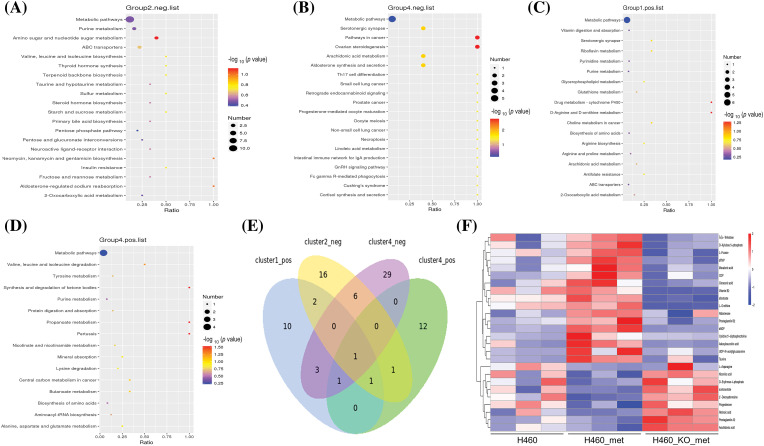
Figure 5. KEGG pathway enrichment analysis. KEGG enrichment scatter plots show the common pathway (metabolic pathways) and other top 19 pathways enriched in Cluster 2 (A) and 4 (B) (negative ion mode). All pathways related to metabolites in Cluster 1 (C) and 4 (D) (positive ion mode) were depicted. (E) Venn diagram of commonly and exclusively differentially expressed pathways, with overall overlapping sites referring to shared pathways in all groups. (F) Heatmap of metabolites enriched in the metabolic pathways among the four selected clusters. The scale represents the expression amount obtained after standardized processing.

Figure 5