
FIGURE 2.
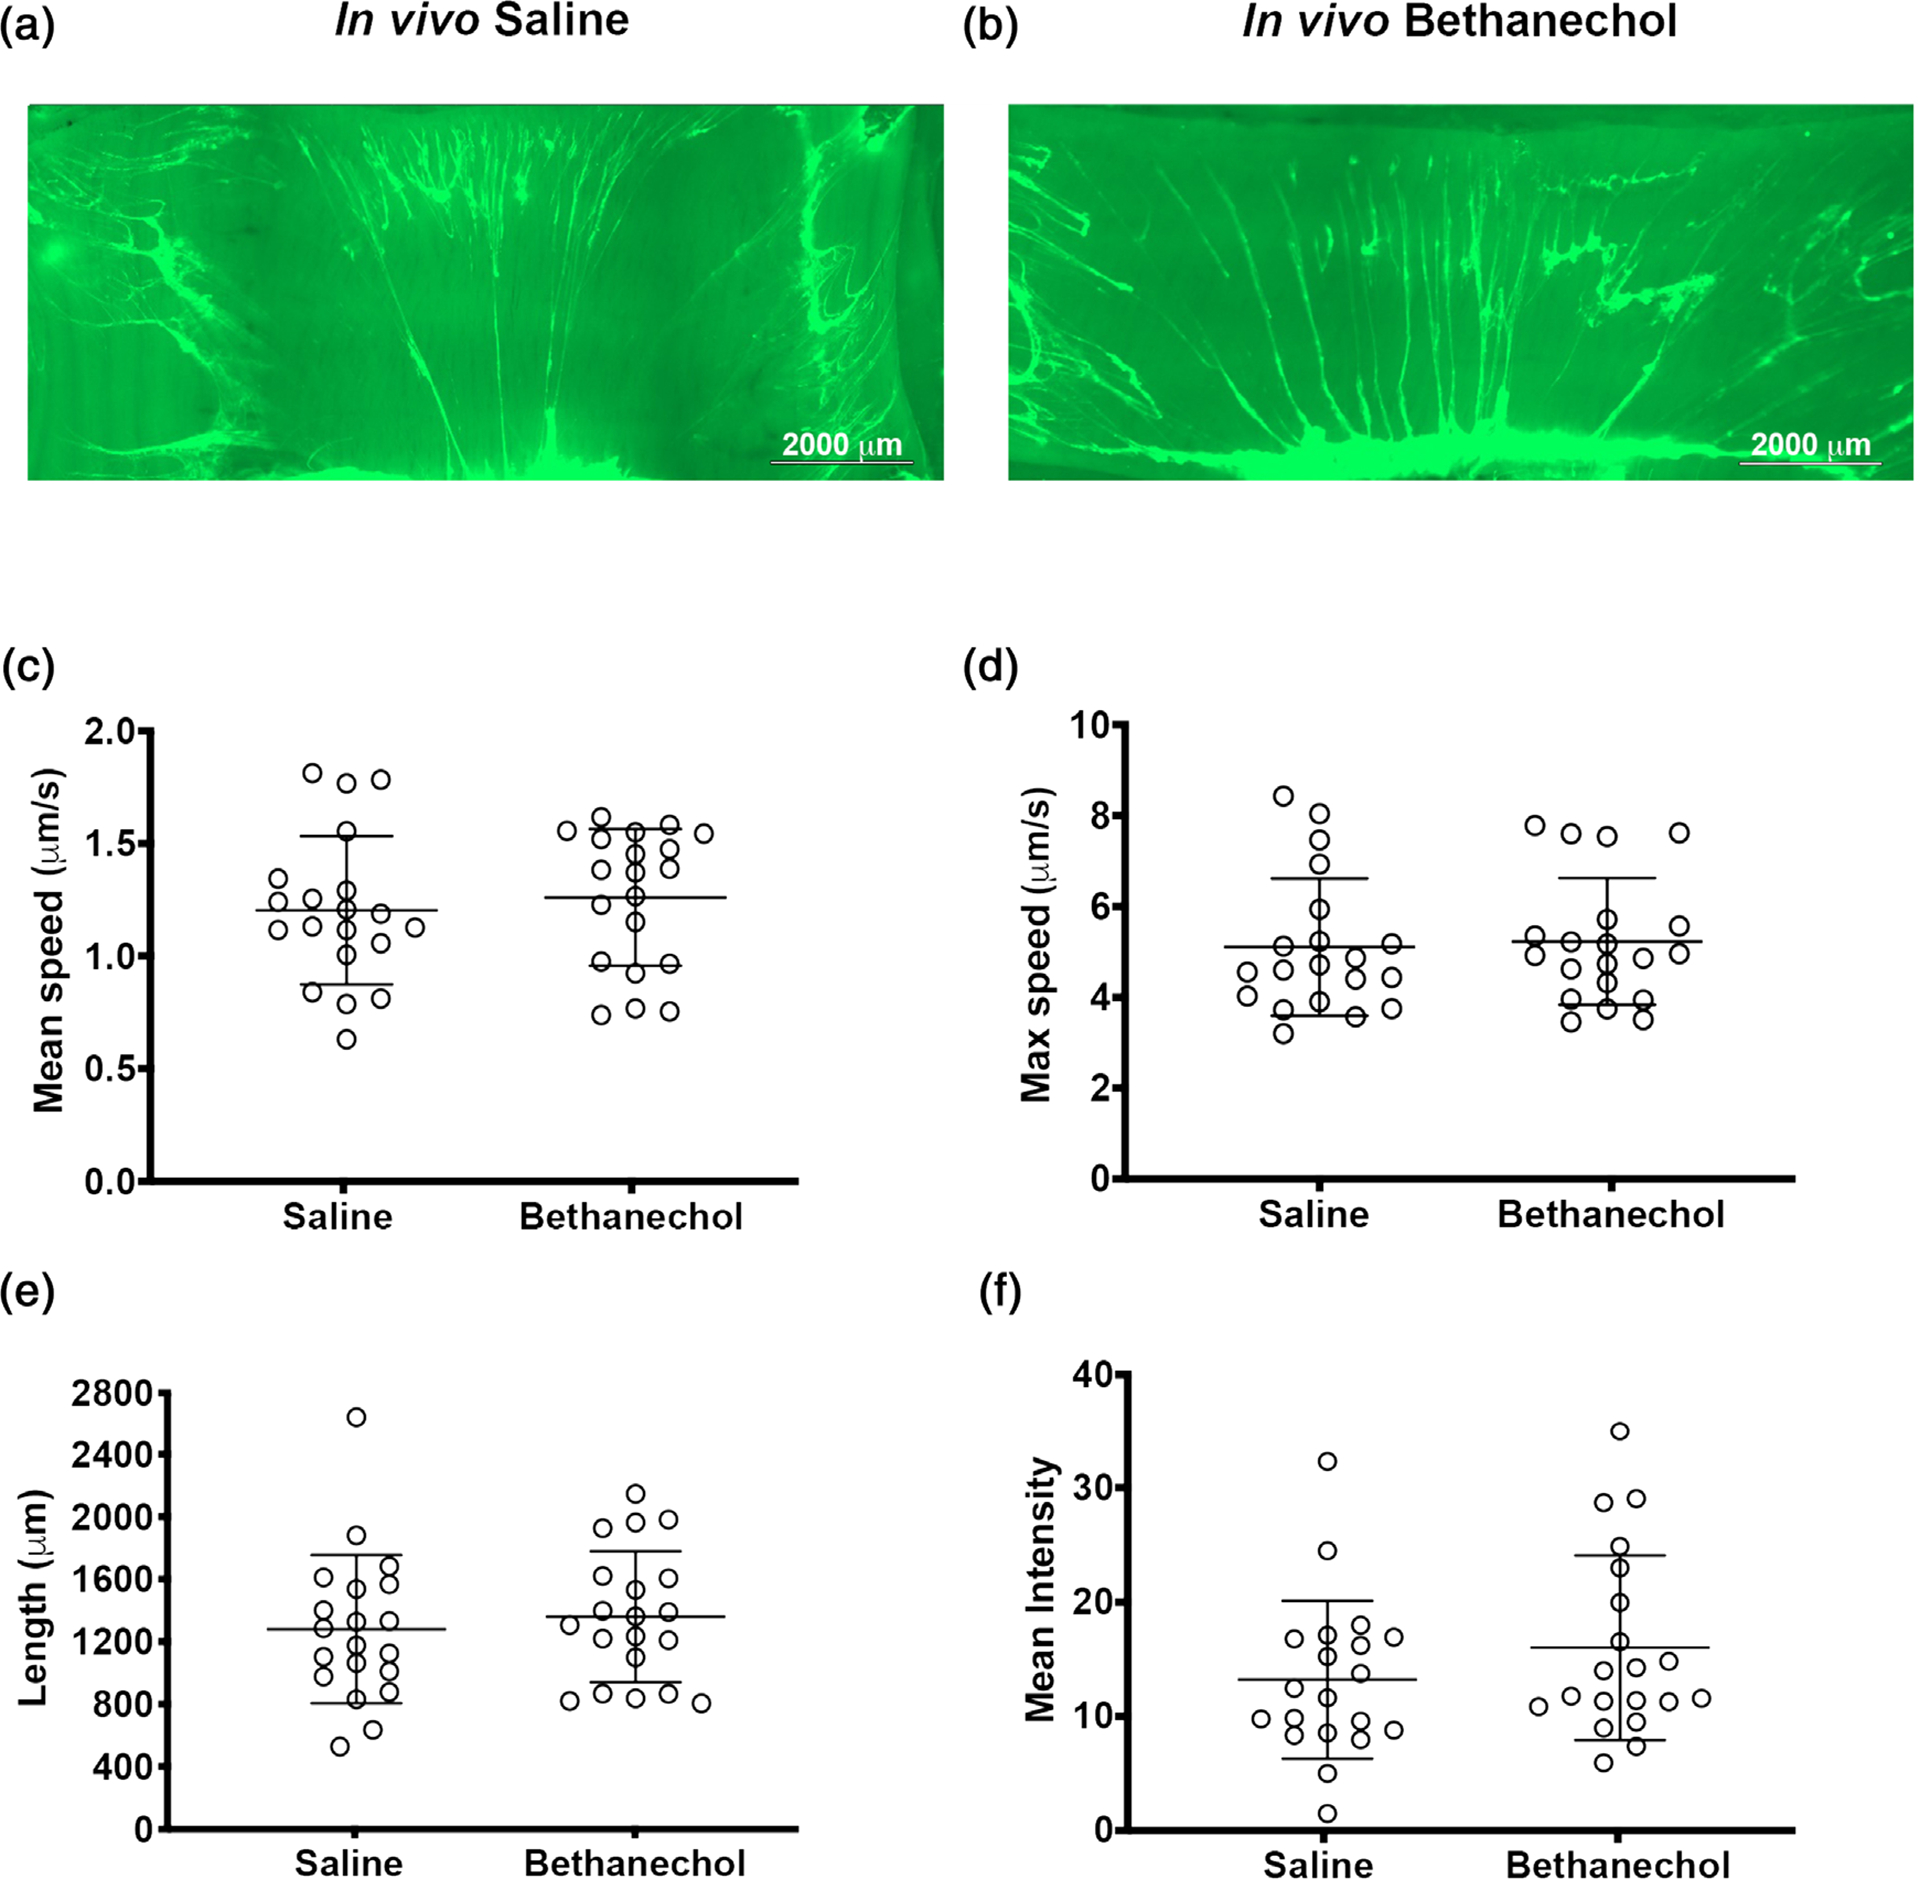
Mucus transport in pig airways challenged with bethanechol and exposed 48 h later to the cholinergic agonist methacholine. (a,b) Representative en face images of an ex vivo piglet tracheas stimulated with methacholine. Mucus is visualized in real time with fluorescent nanospheres (bright green). Mucus often forms strands. Images of tracheas are at the conclusion of the experiment, after methacholine stimulation, in saline-challenged (a) and bethanechol-challenged (b) piglet airways. (c) Mean mucus transport speed. (d) Maximal mucus transport speed. (e) Computer-assigned particle track length. (f) Quantification of the signal intensity of fluorescently labelled mucus on the airway surface at the conclusion of the experiment. n = 20 saline-challenged piglets (10 females and 10 males) and n = 20 bethanechol-challenged pigs (10 females and 10 males). Data were assessed with Student’s unpaired t test. All data are shown as mean values ± SD