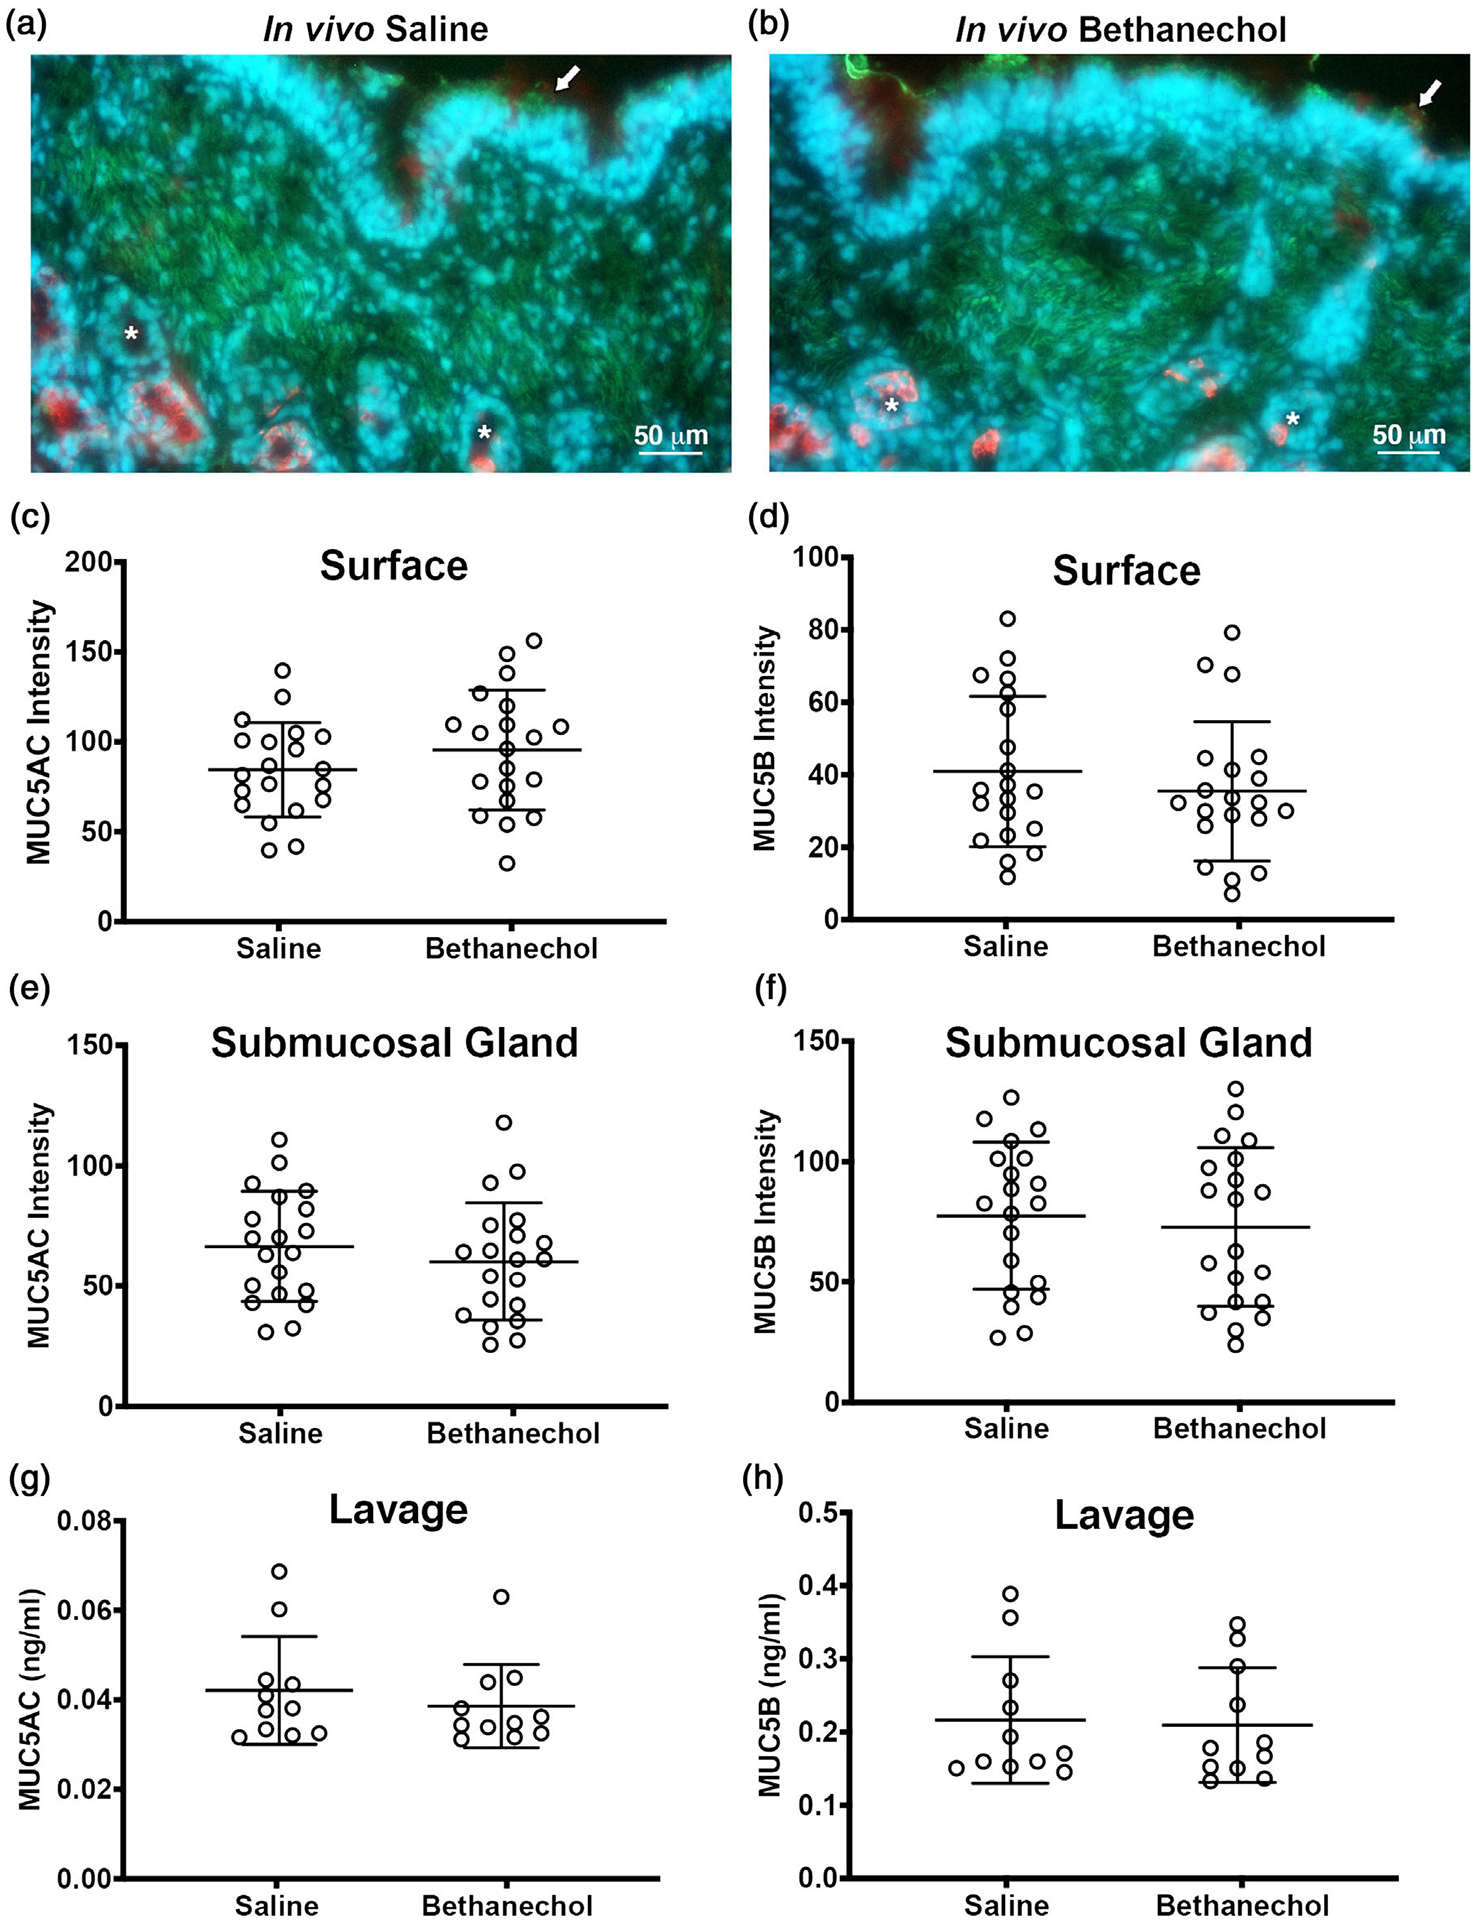
FIGURE 3.

Tracheal mucin staining and bronchoalveolar concentrations in pigs challenged with bethanechol. (a,b) Representative antibody labelling of MUC5AC (green) and MUC5B (red) in 10-μm-thick tracheal cross-sections from piglets challenged with intra-airway saline (a) or intra-airway bethanechol (b). Nuclei are shown in blue (Hoechst). Arrows indicate examples of surface mucus and asterisks examples of submucosal glands. (c–f) MUC5AC and MUC5B staining signal intensity of the surface epithelia (c,d) and submucosal glands (e,f). (g,h) Bronchoalveolar lavage fluid concentrations of MUC5AC (g) and MUC5B (h). For panels c–f, n = 20 saline-challenged piglets (10 females and 10 males) and n = 20 bethanechol-challenged pigs (10 females and 10 males). For panels g and h, n = 11 saline-challenged pigs (five females and six males) and n = 11 bethanechol-challenged pigs (five females and six males). Data points represent the mean fluorescence intensity for each piglet calculated from three to five images analysed (encompassing the anterior, lateral and posterior regions of the trachea). All data are shown as mean values ± SD
