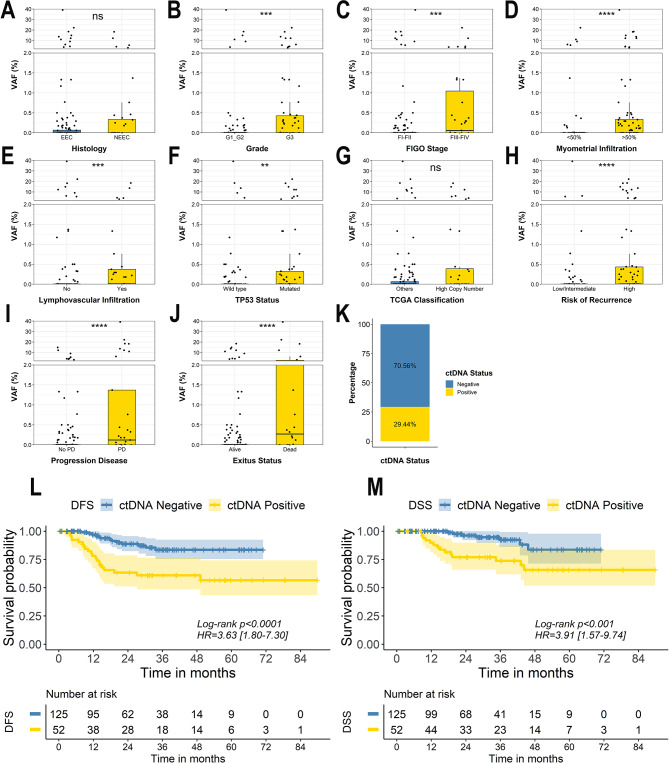
Fig. 3.
The value of ctDNA analyses in endometrial cancer. A-J. Box plots showing the highest variant allelic frequency (VAF %) of the alterations found in the ctDNA accordingly the patient clinical variables. Statistical significance was assessed based on Mann–Whitney U test **p < 0.01, **p < 0.001, ****p < 0.0001. K. Percentage of patients with positive and negative ctDNA levels. L-M. Kaplan Meier curves showing DFS (L) and DSS (M) in patients with positive vs. negative levels of ctDNA. Univariate Cox proportional-hazard model was used to estimate HR and log-rank test to report p-value

