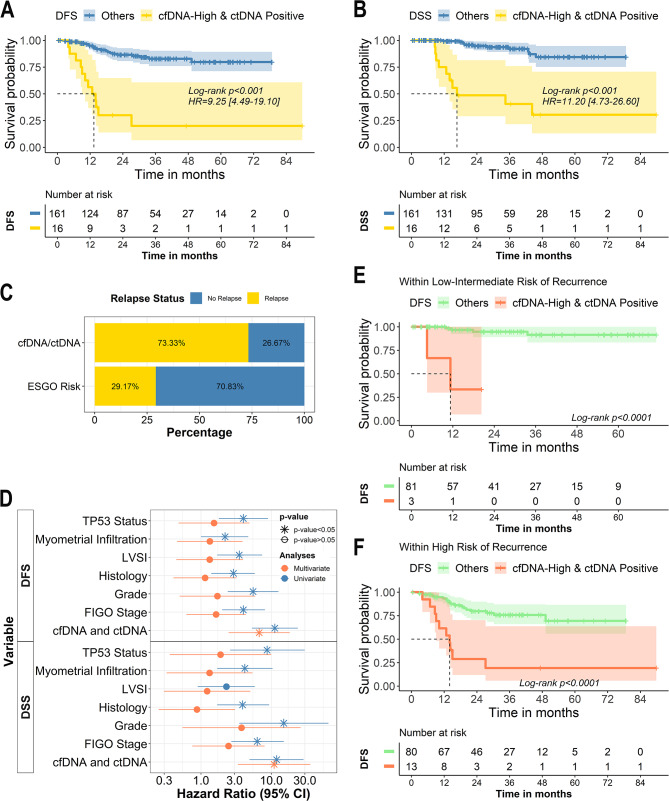
Fig. 4.
Combined analyses of cfDNA and ctDNA identify the patients with the worst clinical outcome. A-B. Kaplan Meier curves showing DFS (A) and DSS (B) in patients according to the pre-surgery high levels of cfDNA and detectable levels of ctDNA. C. Bar plot with the early recurrence status according to the combinatorial approach and the ESGO risk classification D. Graphical representation of the univariate (blue) and multivariate (red) Cox proportional-hazard models. P-value > 0.05 is represented with the *symbol. E-F. Kaplan-Meier curves showing DFS in patients according to the pre-surgery high levels of cfDNA and detectable levels of ctDNA in patients with low or intermediate (E) and high-intermediate or high (F) risk of recurrence based on the ESGO-ESTRO-ESP risk stratification

